


 15 March 2013
2013- n° 61In the fourth quarter of 2012, the labor cost index increases by 0.6% Labor cost index in industry, construction and services - 4th Quarter 2012
15 March 2013
2013- n° 61In the fourth quarter of 2012, the labor cost index increases by 0.6% Labor cost index in industry, construction and services - 4th Quarter 2012
In the fourth quarter of 2012, the labor cost index (LCI) - wages only for the business economy increases by 0.6% (seasonally adjusted data). In the third quarter of 2012 the index had increased by 0.3%.
The labor cost index - wages only
In the fourth quarter of 2012, the labor cost index (LCI) - wages only for the business economy increases by 0.6% (seasonally adjusted data). In the third quarter of 2012 the index had increased by 0.3%.
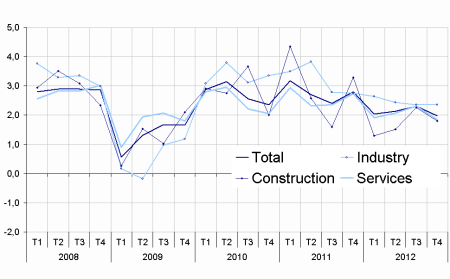
In year-on-year changes, the LCI - wages & salaries increases by 2.0%. Hours worked remain stable (+0.0% in year-on-year change).
graphiqueGraphSSangl – LCI - wages & salaries : Year-on-year changes
Wages rebound in industry and continue to increase in construction
Wages grow by 0.9% in industry after –0.3% in third quarter. In the fourth quarter, they decrease in the gas and electricity sector (-0.9%) but rise by 1.4% in manufacturing after a 0.4% fall. In year-on-year changes, wages rise by 2.4% in industry. In the construction sector, they increase in the fourth quarter by 0.9% after +0.8%. In year-on-year changes, they slow down (+1.8% after +2.3%).
Wages rise by 0.5% in services
Wages continue to rise in services (+0.5% after +0.4%). In particular, they recover in transportation and storage (+0.7% after –0.3%) and increase significantly in financial and insurance activities (+1.3% after +0.5%). By contrast, they slow down in information and communication (+0.1%) and decline slightly in accommodation and food service activities (-0.1%). In year-on-year changes, wages increase by 1.9% in services.
tableauTableau 1 – LCI - wages & salaries
| Quarterly variations (%) | Annual variations (%) | |||
|---|---|---|---|---|
| Q3-12 | Q4-12 | Q3-12 | Q4-12 | |
| Industry | –0.3 | 0.9 | 2.4 | 2.4 |
| Mining and quarrying | 0.1 | 1.2 | 2.4 | 2.5 |
| Manufacturing | –0.4 | 1.4 | 2.4 | 2.6 |
| Electricity, gas, steam and air conditioning supply | –3.6 | –0.9 | 0.9 | –0.5 |
| Water supply; sewerage, waste management and remediation activities | 1.0 | –0.2 | 2.2 | 1.5 |
| Services | 0.4 | 0.5 | 2.3 | 1.9 |
| Wholesale and retail trade; repair of motor vehicles and motorcycles | 0.4 | 0.3 | 2.1 | 1.7 |
| Transportation and storage | –0.3 | 0.7 | 1.9 | 1.6 |
| Accomodation and food service activities | 0.8 | –0.1 | 2.3 | 2.0 |
| Information and communication | 0.5 | 0.1 | 2.3 | 1.5 |
| Financial and insurance activities | 0.5 | 1.3 | 1.7 | 2.8 |
| Real estate activities | 0.2 | 0.8 | 0.9 | 0.9 |
| Professional, scientific and technical activities | 0.6 | 0.3 | 2.5 | 1.8 |
| Administrative and support service activities | 0.3 | 0.1 | 3.0 | 1.1 |
| Construction | 0.8 | 0.9 | 2.3 | 1.8 |
| TOTAL | 0.3 | 0.6 | 2.3 | 2.0 |
Small upward revision
The evolution of wages in the third quarter of 2012 is revised upward by 0.1 point in quarterly variation. The evolution remains unchanged, compared with the same
quarter a year earlier.
The labor cost index – total labour costs
In the fourth quarter of 2012, the labor cost index (LCI) – total labour costs for the business economy increases by 1.0 % (seasonally adjusted data). In the third quarter of 2012 the index had increased by 0.2 %.
In annual variation, the labor cost index (LCI) – total labour costs rises by 1.8 %.
graphiqueGraphSCangl – LCI - total labor cost : Year-on-year changes

Small revision of the Q3 index
The evolution of the labor cost index (LCI) – total labour costs in the third quarter of 2012 is revised upward by 0.1 point in quarterly variation and remains unchanged in year-on-year variation.
Over a year, a slight increase in the rate of exemption of employers’ social contributions
Compared with the same quarter a year earlier, the rate of exemption of employers’ social contributions increases, going from 3.4% in Q4 2011 to 3.6% in Q4 2012. As a consequence, the total labor cost (including employers’ social contributions) increases less than the labor cost index – wages & salaries (+1.8% in year-on-year changes against 2.0%).
tableauTableau 2 – LCI - total labor cost
| Quarterly variations (%) | Annual variations (%) | |||
|---|---|---|---|---|
| Q3-12 | Q4-12 | Q3-12 | Q4-12 | |
| Industry | –0.4 | 1.3 | 2.2 | 2.2 |
| Mining and quarrying | 0.1 | 1.7 | 2.3 | 2.3 |
| Manufacturing | –0.4 | 1.8 | 2.2 | 2.5 |
| Electricity, gas, steam and air conditioning supply | –3.6 | –0.8 | 0.9 | –0.5 |
| Water supply; sewerage, waste management and remediation activities | 1.0 | 0.6 | 2.0 | 1.2 |
| Services | 0.3 | 0.8 | 2.1 | 1.6 |
| Wholesale and retail trade; repair of motor vehicles and motorcycles | 0.3 | 0.9 | 1.8 | 1.5 |
| Transportation and storage | –0.4 | 1.1 | 1.6 | 1.4 |
| Accomodation and food service activities | 1.1 | 0.3 | 1.9 | 1.8 |
| Information and communication | 0.5 | 0.2 | 2.1 | 1.2 |
| Financial and insurance activities | 0.4 | 1.5 | 1.5 | 2.6 |
| Real estate activities | 0.1 | 1.6 | 0.7 | 0.7 |
| Professional, scientific and technical activities | 0.6 | 0.5 | 2.3 | 1.6 |
| Administrative and support service activities | 0.1 | 0.2 | 2.7 | 0.5 |
| Construction | 0.7 | 1.3 | 2.1 | 1.8 |
| TOTAL | 0.2 | 1.0 | 2.1 | 1.8 |
- Sources : Acoss, Dares, Insee
Pour en savoir plus
