


 20 December 2012
2012- n° 309Overall producer prices of agricultural products kept rising in November Indices of agricultural prices - Novembre 2012
20 December 2012
2012- n° 309Overall producer prices of agricultural products kept rising in November Indices of agricultural prices - Novembre 2012
In November, overall producer prices of agricultural products increased by 0.9 % compared to October ; year-over-year they rose by 14.0%.
In November, overall producer prices of agricultural products increased by 0.9 % compared to October ; year-over-year they rose by 14.0%.
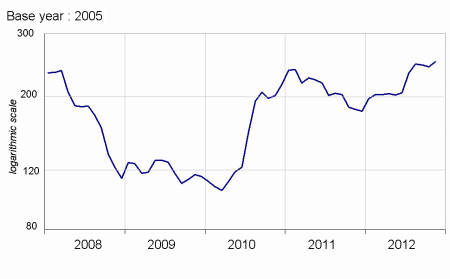
Cereal price rose in november (+3.4 %), reaching a pic over five years. This latest increase resulted from recent forecasts that pointed out a noticeable drop in global crop of maïze and wheat this season.
graphiquecereal – Producer price of cereals
Oleaginous price stayed firm this month (–0.3 %), at a high level. The worldwide rape crop, main oleaginous grain grown in France, was also forecast to decrease slightly this season.
Potato price doubled in November compared with the same month last year (+116.3 %), due to a marked shortfall of supply in North-Western Europe. The bad weather in August spoiled practically a fifth of the crop in England and led as well to a substantial deficit of production in the Netherlands and in Belgium. The dry weather in France during September decreased the yields.
Wine price rose in November (+1.8 %), due both to quality wines and other wines.
Price of fresh fruits went up strongly in November year-over-year (+34.9 %). Price of apple and pear were particularly concerned, rising respectively by 47 % and 40 %, due to a strong decrease in production in Europe.
graphiquevegetable – Producer price of fresh vegetables

Price of fresh vegetables went up year-over-year (+12.5 %). The production of salad was slowed by chilly weather. The onion crop was less considerable than last year. So, the prices were higher for these two vegetables compared to last year. On the demand side, the domestic consumption was sustained for leek, while cauliflower from Britanny sold easily through exportations. Conversely, chicory price decreased due to a weak consumption.
graphiquepig – Producer prices of pigs ans big cattle
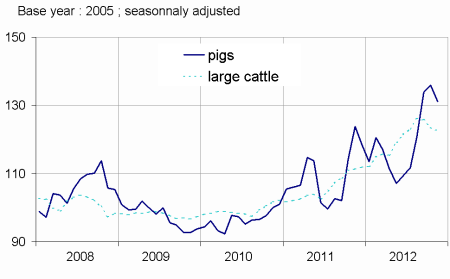
On a seasonally adjusted basis, price of animals went down in November. Price of pig decreased noticeably due to North-american competition that drove down european exportations to other countries. Price of eggs rose again (+46.8 % over one year, more than doubling over two years). The European supply was low due to a delay in the implementation of new sanitary standards in some neighbouring countries. The price reflects also the cost of investments agreed and the increase of intermediate consumptions (cereals).
tableauTab1 – Indices of producer prices of agricultural products (IPPAP)
| Variation as % over | |||||
|---|---|---|---|---|---|
| weights | Nov 2012 | a month | 3 months | a year | |
| raw | seasonally adjusted data | raw | |||
| Agricultural goods output | 1000 | 142.9 | +0.9 | +5.1 | +14.0 |
| excluding fruits and vegetables | 878 | 145.2 | +1.3 | +4.3 | +13.5 |
| Crop output (excluding fruits and vegetables) | 417 | 168.9 | +2.7 | +5.8 | +22.3 |
| Cereals | 115 | 249.2 | +3.4 | +1.6 | +38.5 |
| of which soft wheat | 63 | 267.7 | +3.4 | +2.6 | +48.3 |
| grain maize | 27 | 224.6 | +4.8 | –0.2 | +37.1 |
| Potatoes | 19 | 239.2 | /// | /// | +116.3 |
| Wines | 161 | 126.1 | +1.8 | +4.2 | +5.0 |
| quality wines | 140 | 124.2 | +1.6 | +3.2 | +4.3 |
| other wines | 21 | 138.6 | +3.1 | +10.9 | +8.7 |
| Oleaginous | 28 | 220.2 | –0.3 | –6.3 | +14.2 |
| Horticultural products | 51 | 114.0 | +2.8 | +3.9 | +2.3 |
| Other crop products | 43 | 113.8 | –0.5 | +3.9 | +11.8 |
| Fruits and vegetables (1) | 122 | 126.4 | /// | /// | +18.1 |
| Fresh vegetables | 61 | 117.7 | /// | /// | +12.5 |
| Fresh fruits | 39 | 150.5 | /// | /// | +34.9 |
| Animal output | 461 | 123.7 | –0.4 | +2.4 | +4.3 |
| Animals | 286 | 128.1 | –1.0 | +2.1 | +7.7 |
| of which large cattle | 108 | 122.6 | –0.8 | –2.9 | +10.0 |
| calves | 29 | 121.1 | +1.5 | +1.5 | +1.1 |
| pigs | 64 | 123.5 | –3.5 | +8.7 | +5.9 |
| sheep | 14 | 123.1 | –2.5 | –1.2 | +1.9 |
| poultry | 59 | 148.7 | +0.3 | +5.0 | +10.5 |
| of which chicken | 26 | 147.1 | –0.4 | +4.0 | +10.1 |
| Milk | 159 | 107.2 | 0.0 | +1.4 | –6.5 |
| of which cow milk (2) | 148 | 106.5 | 0.0 | +1.5 | –7.0 |
| Eggs | 13 | 229.6 | +3.8 | +12.5 | +46.8 |
- (1) Including vegetables for industry.
- (2) The price for November is not yet known and therefore is estimated by carrying forward the seasonally adjusted price of October
- Sources: INSEE - SSP (ministry of agriculture)
Purchase price of the means of agricultural production remained stable in November
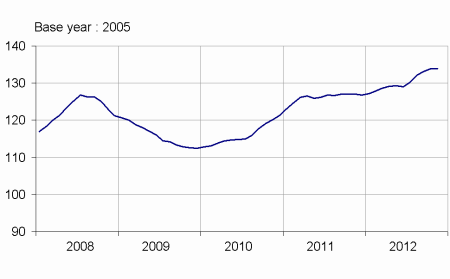
The price of intermediate consumptions stabilised in november (+0.1 %). The decrease of energy price was amply offset by the rise of animal feeding stuff. Price of investment was almost stable (–0.1%).
graphiquemeans – Purchase price of the means of agricultural production
tableauTab2 – Indices of purchase prices of the means of agricultural production (IPAMPA)
| weights | Nov 2012 | Variation as % over | |||
|---|---|---|---|---|---|
| a month | 3 month | a year | |||
| Total input | 1000 | 133.9 | +0.1 | +1.3 | +5.4 |
| Goods and services currently consumed in agriculture | 758 | 138.2 | +0.1 | +1.6 | +6.6 |
| Energy (1) | 84 | 154.5 | –1.4 | –1.3 | +5.1 |
| Seeds | 51 | 119.2 | –0.1 | +2.0 | +3.1 |
| Fertilisers and soil improvers | 92 | 167.7 | +0.3 | +1.0 | +0.8 |
| Plant protection products | 77 | 106.3 | –0.2 | +0.2 | +0.1 |
| Animal feeding stuffs | 189 | 163.9 | +1.0 | +5.6 | +20.2 |
| Veterinary expenses | 38 | 118.8 | –0.4 | +0.3 | +2.9 |
| Small equipment and tools | 14 | 112.8 | +0.4 | +0.6 | 0.0 |
| Maintenance of materials | 56 | 130.7 | +0.1 | +0.3 | +3.5 |
| Maintenance of buildings | 9 | 124.5 | +0.3 | +0.3 | +1.8 |
| Other goods and services | 149 | 112.4 | –0.2 | –0.8 | +0.2 |
| Goods and services contributing to investment | 242 | 120.4 | –0.1 | +0.3 | +1.4 |
| Material | 170 | 117.7 | –0.2 | +0.3 | +1.6 |
| Tractors | 71 | 114.5 | –0.4 | +0.1 | +1.2 |
| Machinery and plant for cultivation | 36 | 120.2 | +0.1 | +0.5 | +1.5 |
| Machinery and plant for harvesting | 37 | 118.5 | 0.0 | +0.1 | +2.3 |
| Utility vehicles | 16 | 113.5 | 0.0 | –0.3 | +1.1 |
| Buildings | 72 | 126.6 | +0.2 | +0.2 | +1.0 |
- (1) The repayment of 5 cents per litre of fuel of the domestic tax on energetical products (TICPE) benefiting farmers has been applied in advance for the year 2012
- Sources : Insee - SSP (ministry of agriculture)
Documentation
Methodology (pdf,122 Ko)
Pour en savoir plus
Time series : Indices of agricultural prices
