


 15 February 2012
2012- n° 42French GDP increased by 0.2% in Q4 and +1.7% over the year Quarterly national accounts - second estimate - 4st Quarter 2011
15 February 2012
2012- n° 42French GDP increased by 0.2% in Q4 and +1.7% over the year Quarterly national accounts - second estimate - 4st Quarter 2011
In 2011 Q4, French gross domestic product (GDP) in volume* increased by +0.2% after +0.3% the previous quarter. Over the year, GDP increased by 1.7% (after +1.4% in 2010).
In 2011 Q4, French gross domestic product (GDP) in volume* increased by +0.2% after +0.3% the previous quarter. Over the year, GDP increased by 1.7% (after +1.4% in 2010).
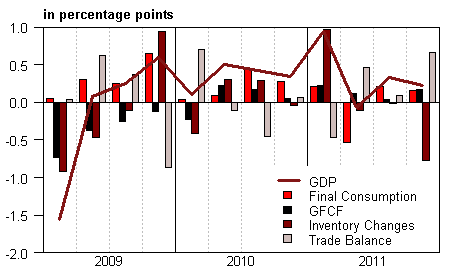
Households’ consumption expenditure slightly decelerated by the end of the year (+0.2% after +0.3%), while gross fixed capital formation (GFCF) accelerated (+0.9% after +0.2%). Overall, total domestic demand (excluding inventory changes) drove GDP on for 0.3 point of growth after 0.2 in Q3. Exports grew at the same pace as the last summer (+1.2%), while imports dropped (–1.2% after +0.7%). Hence foreign trade balance contributed positively to GDP growth in Q4 (+0.7 point after +0.1 point the previous quarter). This contribution is overcompensated by changes in inventories contributing for –0.8 point to GDP growth after being neutral in Q3.
Total production slightly accelerated
Production in goods and services slightlty accelerated (+0.4% after +0.3%). Production upturned in transport equipment (+4.6% after –2.1%) - mostly in aeronautics - and in the coke and refined petroleum industry (+3.9% after –1.5%). Besides, production of other manufacturing industries and “energy, water and waste” stepped back. Over the year, total production grew by 2.2% (after +1.6% in 2010).
Car purchases by NFC drove GFCF up
Total GFCF accelerated in Q4 (+0.9% after +0.2%), contributing for +0.2 point to GDP growth. GFCF in manufactured goods - especially cars - bottomed out
graphiqueGraph1 – GDP and its main components
tableauTab1 – GOODS AND SERVICES: SUPPLY AND USES CHAIN-LINKED VOLUMES
| 2011 Q1 | 2011 Q2 | 2011 Q3 | 2011 Q4 | 2010 | 2011 | |
|---|---|---|---|---|---|---|
| GDP | 0.9 | -0.1 | 0.3 | 0.2 | 1.4 | 1.7 |
| Imports | 2.8 | -1.0 | 0.7 | -1.2 | 8.3 | 5.0 |
| Households' consumption expenditure | 0.2 | -1.0 | 0.3 | 0.2 | 1.3 | 0.3 |
| General government's consumption expenditure | 0.4 | 0.1 | 0.2 | 0.2 | 1.2 | 0.9 |
| GFCF | 1.1 | 0.6 | 0.2 | 0.9 | -1.4 | 2.9 |
| of which Non financial corporated and unincorporated enterprises | 1.9 | 0.3 | -0.4 | 1.4 | 2.0 | 4.2 |
| Households | -0.3 | 1.2 | 1.2 | 0.1 | -1.4 | 2.6 |
| General government | 1.5 | 0.7 | 0.5 | 0.5 | -9.7 | -0.1 |
| Exports | 1.4 | 0.7 | 1.2 | 1.2 | 9.3 | 5.0 |
| Contributions : | ||||||
| Internal demand excluding inventory changes | 0.4 | -0.4 | 0.2 | 0.3 | 0.8 | 1.0 |
| Inventory changes | 1.0 | -0.1 | 0.0 | -0.8 | 0.5 | 0.9 |
| Net foreign trade | -0.5 | 0.5 | 0.1 | 0.7 | 0.1 | -0.1 |
tableauTab2 – Sectoral accounts
| 2011 Q1 | 2011 Q2 | 2011 Q3 | 2011 Q4 | 2010 | 2011 (ovhg) | |
|---|---|---|---|---|---|---|
| Profit ratio of NFC* (level) | 29.9 | 29.0 | 29.2 | 30.1 | ||
| Household purchasing power | 0.2 | 0.6 | 0.0 | 0.8 | 1.3 |
- *NFC: non-financial corporations
tableauTab3 – GDP and components : prices indices
| 2011 Q1 | 2011 Q2 | 2011 Q3 | 2011 Q4 | 2010 | 2011 | |
|---|---|---|---|---|---|---|
| GDP | 0.6 | 0.4 | 0.4 | 0.5 | 0.8 | 1.6 |
| Imports | 3.4 | 0.1 | 0.3 | 1.1 | 4.0 | 5.4 |
| Cons. Exp. : | ||||||
| - Households | 0.7 | 0.5 | 0.3 | 0.7 | 1.2 | 2.0 |
| - GG* | 0.3 | 0.2 | 0.2 | 0.2 | 1.5 | 1.0 |
| Total GFCF | 1.2 | 0.7 | 0.5 | 0.5 | 1.2 | 2.8 |
| - of which Households | 1.2 | 1.5 | 1.1 | 0.8 | 2.3 | 4.2 |
| - of which NFE | 1.1 | 0.4 | 0.3 | 0.3 | 0.6 | 2.0 |
| - of which GG | 1.9 | 0.5 | 0.4 | 0.4 | 1.9 | 3.4 |
| Exports | 1.8 | 0.4 | 0.3 | 0.4 | 1.7 | 3.6 |
- *GG: General Government
tableauTab4 – Manufactured goods : supply and uses in volume
| 2011 Q1 | 2011 Q2 | 2011 Q3 | 2011 Q4 | 2010 | 2011 | |
|---|---|---|---|---|---|---|
| Industrie’s production | 2.9 | -0.7 | -0.4 | 0.6 | 4.3 | 3.0 |
| - of which value added | 2.1 | -0.4 | 0.0 | -0.2 | 3.3 | 2.8 |
| Imports | 2.8 | -0.7 | 0.4 | -1.6 | 11.0 | 5.8 |
| Intermediate uses | 1.9 | -0.3 | -0.1 | 0.6 | 3.1 | 2.7 |
| Cons. Exp. : | ||||||
| - of households | 0.7 | -2.0 | -0.2 | 0.5 | 1.3 | 0.4 |
| - of GG | 0.7 | 0.3 | 0.9 | 0.9 | 5.3 | 3.6 |
| Total GFCF | 3.0 | 1.4 | -0.8 | 2.2 | 6.7 | 9.1 |
| - of which NFC | 3.3 | 1.5 | -1.0 | 2.4 | 8.3 | 10.1 |
| - of which GG | 0.5 | 0.5 | 0.4 | 0.5 | -3.8 | 0.4 |
| Exports | 0.8 | 0.6 | 1.0 | 1.5 | 11.0 | 4.4 |
| Inventory changes (contribution) | 2.3 | -0.3 | -0.3 | -2.0 | 1.6 | 1.8 |
tableauTab5 – Households’ disposable income and ratios of households’ account
| 2011 Q1 | 2011 Q2 | 2011 Q3 | 2011 Q4 | 2010 | 2011 (ovhg) | |
|---|---|---|---|---|---|---|
| HDI | 0.9 | 1.1 | 0.3 | 2.0 | 3.2 | |
| Household purchasing power | 0.2 | 0.6 | 0.0 | 0.8 | 1.3 | |
| HDI by cu* (purchasing power) | 0.0 | 0.4 | -0.2 | 0.1 | 0.6 | |
| Adjusted HDI (purchasing power) | 0.3 | 0.5 | 0.0 | 0.8 | 1.3 | |
| Saving rate (level) | 16.0 | 17.4 | 17.1 | 16.1 | ||
| Financial saving rate (level) | 6.9 | 8.1 | 7.7 | 7.0 |
- *cu: consumption unit
tableauTab6 – Ratios of non-financial corporations’ account
| 2011 Q1 | 2011 Q2 | 2011 Q3 | 2011 Q4 | 2010 | |
|---|---|---|---|---|---|
| Profit share | 29.9 | 29.0 | 29.2 | 30.1 | |
| Investment ratio | 19.1 | 19.2 | 18.9 | 18.7 | |
| Savings ratio | 14.6 | 13.7 | 13.6 | 14.6 | |
| Self-financing ratio | 76.5 | 71.6 | 71.9 | 78.3 |
(+2.2% after –0.8%). Moreover, expenditure in information and communication and in business services grew concomitantly. Besides GFCF in construction grew less markedly than in Q3 (+0.4% after +0.9%). Over the year, GFCF increased by 2.9% (after a 1.4% fall in 2010) and contributed for +0.6 point to the annual GDP growth.
Consumption slowed down
Households’ consumption expenditure rose by 0.2% in Q4 after +0.3%. Energy expenditure fell (–3.6% after +5.7%) due to mild weather conditions this fall. Expenditure in food products went on decreasing though less markedly (–0.1% after –0.8%). Besides, car purchases renewed with growth in Q4. Expenditures in services slowed down all together, with the exception of accomodation and food services which held steady after a drop in the summer. Over 2011, households’ consumption expenditure slowed down (+0.3% after +1.3%) and contributed for +0.1 point to GDP growth.
Exports rose, imports fell
Exports went on growing in Q4 (+1.2%), mostly driven by transport equipment sales (+7.9% after +3.6%). Meanwhile, imports fell (–1.2% after +0.7%), weighed down by almost all goods. Consequently, foreign trade balance improved and contributed for +0.7 point to GDP growth (after +0.1 point). Over 2011, exports and imports grew at the same pace (+5.0%). Hence, the contribution of the foreign trade balance to GDP growth is almost neutral: –0.1 point after +0.1 point in 2010.
Changes in inventories weighed down GDP growth this quarter
In Q4, changes in inventories accounted for –0.8 point of GDP growth, half of this contribution being imputable to transport equipments (–0.4 point). But given the growth rate carried over at the beginning of the year, they contributed for +0.9 point to the annual GDP growth (after +0.5 point in 2010).
Revisions
GDP growth in 2011 Q3 is still estimated at 0.3% Revisions with respect to the previous publications are small. They are mainly due to the update of seasonal and working day adjustment.
Pour en savoir plus
Time series : Operations on goods and services
Time series : Gross domestic product balance
Time series : Institutional sector accounts
Time series : Branch accounts
