


 28 December 2011
2011- n° 317At the end of the third quarter of 2011, the public debt reached 1688.9 billion euros Debt of the general government according to the Maastricht definition - 3rd Quarter
2011
28 December 2011
2011- n° 317At the end of the third quarter of 2011, the public debt reached 1688.9 billion euros Debt of the general government according to the Maastricht definition - 3rd Quarter
2011
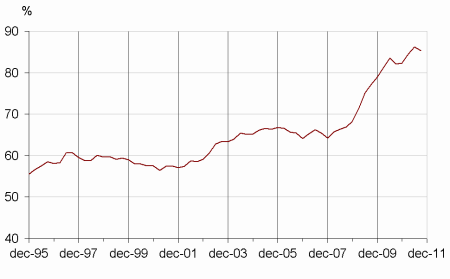
At the end of the third quarter of 2011, the public debt, which is a gross debt, reached 1688.9 billion euros, a 3.6 billion euros decrease compared to Q2 2011. As a percentage of GDP, the debt amounted approximately to 85.3%, instead of 86.2% at the end of Q2 2011. The general governement net debt (*) kept growing and represented approximately 78.6% of the GDP, instead of 77.8% at Q2 2011.
A 3.6 billion euros decrease of the public debt
At the end of the third quarter of 2011, the public debt, which is a gross debt, reached 1688.9 billion euros, a 3.6 billion euros decrease compared to Q2 2011. As a percentage of GDP, the debt amounted approximately to 85.3%, instead of 86.2% at the end of Q2 2011. The general governement net debt (*) kept growing and represented approximately 78.6% of the GDP, instead of 77.8% at Q2 2011.
graphiqueGraphIR_EN – Debt of the general government according to the Maastricht definition (% of GDP)
tableauTableau 1 – The debt of the general government according to the Maastricht definition at the end of Q3 2011 by sub-sector and by instrument category
| Q3 2010 | Q4 2010 | Q1 2011 | Q2 2011 | Q3 2011 | |
|---|---|---|---|---|---|
| General government | 1575.0 | 1591.2 | 1646.1 | 1692.5 | 1688.9 |
| % of GDP | 82.1% | 82.3% | 84.5% | 86.2% | 85.3% |
| of which, by sub-sector : | |||||
| State | 1238.1 | 1245.0 | 1286.5 | 1339.1 | 1330.7 |
| Central agencies | 16.4 | 15.0 | 11.9 | 10.7 | 10.8 |
| Local government | 149.5 | 160.6 | 156.5 | 153.8 | 152.9 |
| Social security funds | 171.0 | 170.6 | 191.2 | 189.0 | 194.6 |
| of which, by category : | |||||
| Currency and deposits | 22.3 | 23.0 | 26.4 | 28.2 | 31.0 |
| Securities other than shares | 1341.9 | 1346.6 | 1406.7 | 1467.0 | 1457.2 |
| of which : | |||||
| Short-term securities | 258.4 | 238.7 | 243.8 | 254.4 | 266.8 |
| Long-term securities | 1083.5 | 1107.9 | 1162.9 | 1212.5 | 1190.5 |
| Loans | 210.7 | 221.6 | 213.0 | 197.4 | 200.6 |
| of which : | |||||
| Short-term loans | 31.8 | 27.9 | 26.9 | 9.9 | 12.3 |
| Long-term loans | 179.0 | 193.7 | 186.1 | 187.4 | 188.4 |
- Source : National accounts - Insee, DGFiP, Banque de France
(*) The public net debt is defined as the difference between the public debt according to the Maastricht definition and the deposits, loans and securities other than shares held by the general government over the other sectors. Those assets are accounted in their nominal value.
Pour en savoir plus
