


 15 May 2012
2012- n° 123In 2012 Q1, French GDP held steady (0.0 %) Quarterly national accounts - second estimate - 1st Quarter 2012
15 May 2012
2012- n° 123In 2012 Q1, French GDP held steady (0.0 %) Quarterly national accounts - second estimate - 1st Quarter 2012
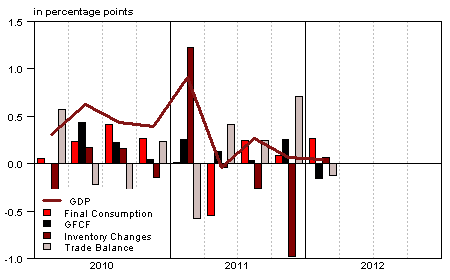
In 2012 Q1, French gross domestic product (GDP) in volume* levelled off (0.0 %) after a small increase in Q4 (+0.1 %).
In 2012 Q1, French gross domestic product (GDP) in volume* levelled off (0.0 %) after a small increase in Q4 (+0.1 %).
Households’ consumption expenditure stuttered (+0.2 % after +0.1 %), while gross fixed capital formation (GFCF) decreased (–0.8 % after +1.3 %). Overall, total domestic demand (excluding inventory changes) drove GDP on for only 0.1 point of growth after 0.3 point in Q4.
Imports renewed with growth (+0.7 % after -1.4 % in Q4), while exports slowed down (+0.3 % after +1.1 %). Consequently, foreign trade balance contributed negatively to GDP growth (–0.1 point after +0.7 point).
In Q1, changes in inventories contributed positively to GDP growth : +0.1 point after -1.0 point in the end of 2011.
Total production levelled off
In 2012 Q1, poduction in goods and services was almost stable (+0.1 % after +0.2 %). Production in manufactured goods stepped back (–0.8 % after +0.3 %), particularly in coke and refined petroleum due to the shutdown of some refineries. However, production of energy upturned (+2.1 % after –1.6 %) due to the harsh weather conditions. At the same time, production in services grew slightly in Q1 (+0.2 % as in 2011 Q4).
graphiqueGraph1 – GDP and its main components
tableauTab1 – GOODS AND SERVICES: SUPPLY AND USES CHAIN-LINKED VOLUMES
| 2011 Q2 | 2011 Q3 | 2011 Q4 | 2012 Q1 | 2011 | 2012 (ovhg) | |
|---|---|---|---|---|---|---|
| GDP | 0.0 | 0.3 | 0.1 | 0.0 | 1.7 | 0.2 |
| Imports | -0.6 | 0.4 | -1.4 | 0.7 | 5.2 | -0.3 |
| Households' consumption expenditure | -1.0 | 0.4 | 0.1 | 0.2 | 0.2 | 0.2 |
| General government's consumption expenditure | 0.0 | 0.2 | 0.2 | 0.5 | 0.2 | 0.7 |
| GFCF | 0.7 | 0.2 | 1.3 | -0.8 | 3.5 | 0.4 |
| of which Non financial corporated and unincorporated enterprises | 0.3 | -0.5 | 1.9 | -1.4 | 5.1 | -0.2 |
| Households | 1.3 | 1.2 | 0.3 | -0.2 | 3.2 | 0.9 |
| General government | 0.2 | 0.3 | 1.0 | -0.1 | -1.8 | 0.8 |
| Exports | 0.9 | 1.4 | 1.1 | 0.3 | 5.5 | 2.1 |
| Contributions : | ||||||
| Internal demand excluding inventory changes | -0.4 | 0.3 | 0.3 | 0.1 | 0.9 | 0.4 |
| Inventory changes | 0.0 | -0.3 | -1.0 | 0.1 | 0.8 | -0.8 |
| Net foreign trade | 0.4 | 0.2 | 0.7 | -0.1 | 0.0 | 0.6 |
tableauTab2 – Sectoral accounts
| 2011 Q2 | 2011 Q3 | 2011 Q4 | 2012 Q1 | 2011 | 2012 (ovhg) | |
|---|---|---|---|---|---|---|
| Profit ratio of NFC* (level) | 28.4 | 28.3 | 28.1 | 28.5 | ||
| Household purchasing power | 0.3 | 0.0 | 0.0 | 0.5 | 0.0 |
- *NFC: non-financial corporations
tableauTab3 – GDP and components : prices indices
| 2011 Q2 | 2011 Q3 | 2011 Q4 | 2012 Q1 | 2011 | 2012 (ovhg) | |
|---|---|---|---|---|---|---|
| GDP | 0.4 | 0.4 | 0.5 | 0.3 | 1.3 | 0.9 |
| Imports | 0.2 | 0.7 | 1.0 | 0.8 | 5.4 | 2.0 |
| Cons. Exp. : | ||||||
| - Households | 0.5 | 0.4 | 0.6 | 0.7 | 2.1 | 1.5 |
| - GG* | 0.3 | 0.2 | 0.2 | 0.1 | 1.4 | 0.5 |
| Total GFCF | 0.7 | 0.6 | 0.6 | 0.8 | 2.9 | 1.7 |
| - of which Households | 1.5 | 1.1 | 0.6 | 1.0 | 3.8 | 2.3 |
| - of which NFE | 0.5 | 0.4 | 0.5 | 0.7 | 2.3 | 1.5 |
| - of which GG | 0.4 | 0.7 | 0.9 | 0.6 | 3.6 | 1.7 |
| Exports | 0.2 | 0.2 | 0.4 | 0.6 | 3.2 | 1.1 |
- *GG: General Government
tableauTab4 – Manufactured goods : supply and uses in volume
| 2011 Q2 | 2011 Q3 | 2011 Q4 | 2012 Q1 | 2011 | 2012 (ovhg) | |
|---|---|---|---|---|---|---|
| Industrie’s production | -1.0 | 0.0 | 0.3 | -0.8 | 3.2 | -0.8 |
| - of which value added | -1.2 | -0.2 | -0.3 | -0.4 | 0.7 | -1.1 |
| Imports | 0.2 | 0.1 | -2.0 | 1.6 | 6.7 | 0.2 |
| Intermediate uses | -0.4 | 0.2 | 0.4 | -0.1 | 2.9 | 0.2 |
| Cons. Exp. : | ||||||
| - of households | -1.7 | 0.3 | 0.4 | -0.5 | 0.9 | -0.5 |
| - of GG | 0.7 | 1.1 | 0.3 | 1.0 | 3.6 | 1.9 |
| Total GFCF | 0.4 | -1.1 | 2.6 | -4.0 | 7.3 | -2.6 |
| - of which NFC | 0.3 | -1.4 | 2.9 | -4.5 | 7.6 | -3.0 |
| - of which GG | 0.6 | 0.6 | 0.6 | 0.6 | -0.5 | 1.5 |
| Exports | 0.7 | 1.4 | 1.5 | 1.5 | 4.5 | 3.5 |
| Inventory changes (contribution) | 0.0 | -0.9 | -2.5 | -0.1 | 1.9 | -2.4 |
tableauTab5 – Households’ disposable income and ratios of households’ account
| 2011 Q2 | 2011 Q3 | 2011 Q4 | 2012 Q1 | 2011 | 2012 (ovhg) | |
|---|---|---|---|---|---|---|
| HDI | 0.8 | 0.4 | 0.6 | 2.6 | 0.8 | |
| Household purchasing power | 0.3 | 0.0 | 0.0 | 0.5 | 0.0 | |
| HDI by cu* (purchasing power) | 0.2 | -0.2 | -0.2 | -0.1 | 0.0 | |
| Adjusted HDI (purchasing power) | 0.4 | 0.1 | 0.0 | 0.8 | 0.0 | |
| Saving rate (level) | 16.6 | 16.3 | 16.2 | 16.2 | ||
| Financial saving rate (level) | 7.6 | 7.1 | 7.0 | 7.1 |
- *cu: consumption unit
tableauTab6 – Ratios of non-financial corporations’ account
| 2011 Q2 | 2011 Q3 | 2011 Q4 | 2012 Q1 | 2011 | |
|---|---|---|---|---|---|
| Profit share | 28.4 | 28.3 | 28.1 | 28.5 | |
| Investment ratio | 20.1 | 20.0 | 20.3 | 20.1 | |
| Savings ratio | 13.4 | 13.0 | 13.0 | 13.5 | |
| Self-financing ratio | 66.4 | 65.2 | 63.8 | 66.9 |
Households’ consumption remained sluggish
In 2012 Q1, households’ consumption expenditure slightly accelerated (+0.2 % after +0.1 %), mostly driven by the rebound of energy, water and waste (+7.6 % after –3.6 %), due to the cold spell in february.
On the contrary, expenditure in manufactured goods stepped back (–0.5 % after +0.4 %), in particular on transport equipment (–6.5 % after +5.0 %). Expenditures in services remained sluggish (+0.1 % after 0.0 %).
Total GFCF stepped back
In 2012 Q1, total GFCF decreased by 0.8% (after +1.3 %). In particular non-financial corporations’ GFCF fell (–1.4 % after +1.9 %), following the bottoming out of transport equipment in 2011 Q4 (-13.4 % after +10.4 %). Public administrations’ investment stepped back (–0.1 % after +1.0 %). In particular investment in civil engineering dropped, due to difficult weather conditions. Households’ GFCF stepped back (–0.2 % after +0.3 %).
Slight downward contribution of foreign trade balance
In 2012 Q1, imports renewed with growth (+0.7 % after –1.4 % in 2011 Q4). This increase was mainly due to coke and refined petroleum (+15.5 % after –7.6 %), which replaced national production, and also to “other industrial goods” (+1.5 % after –1.9 %). At the same time exportations slowed down (+0.3 % after +1.1 %), in particular by repercussions of the dynamic exports in 2011 Q4 of agricultural goods (–16.1 % after +14.0 %) and transport equipment (0.0 % after +6.8 %).
Inventories contributed thinly to the activity
In 2011 Q4, firm’s inventories remained close to that of 2012 Q1; changes in inventories had a limited contribution to growth after a negative contribution in 2011 Q4 (+0.1 point after –1.0 point).
Revisions
Revisions are larger this quarter than the previous publications, but their magnitude is typical of the first quarter. They come from the benchmarking on reviewed annual account in year 2009 (GDP growth reviewed by –0.4 point, at –3.0 %), 2010 (+0.2 point at +1.6 %) and 2011 (unchanged at +1.7 %) and from the reestimation of calendar and seasonal adjustment models. They result in quarterly revisions, the most marked being the upscale of 2010 Q1 (from +0.1 % to +0.3 %) and the downscale of 2011 Q4 (from +0.2 % to +0.1 %).
Pour en savoir plus
Time series : Operations on goods and services
Time series : Gross domestic product balance
Time series : Institutional sector accounts
Time series : Branch accounts
