


 11 April 2013
2013- n° 85The Consumer Prices Index increased by 0.8% in March 2013; it rose by 1.0% year-on-year Consumer price index - final results - March 2013
11 April 2013
2013- n° 85The Consumer Prices Index increased by 0.8% in March 2013; it rose by 1.0% year-on-year Consumer price index - final results - March 2013
In March 2013, the Consumer Price index (CPI) increased by 0.8%, after a rise by 0.3% in February. Year on year, the CPI was up 1.0% in March like in February. Excluding tobacco, the CPI went up also by 0.8% in March (+0.9% year on year). Seasonally adjusted, it rose by 0.3% in March and by 1.0% year on year (after +1.1% in February 2013).
Monthly change: +0.8%; Year on year: +1.0%
In March 2013, the Consumer Price index (CPI) increased by 0.8%, after a rise by 0.3% in February. Year on year, the CPI was up 1.0% in March like in February. Excluding tobacco, the CPI went up also by 0.8% in March (+0.9% year on year). Seasonally adjusted, it rose by 0.3% in March and by 1.0% year on year (after +1.1% in February 2013).
The largest upward pressures on the change in the CPI of March came mainly from a seasonal surge in manufactured product prices at the end of the winter sales and, to a lesser extend, from some prices of services associated with the winter holidays and from the seasonal rise in fresh foodstuff prices. Conversely, energy prices, especially those of petroleum products, declined in March.
Manufactured product prices rebounded
After the end of the winter sales in most of the French departments, prices of manufactured products rebounded in March (+2.0% in 2013; +1.8% in 2012) but were stable year on year. Thus, prices of clothing and footwear increased by 12.2% in March (+11.7% in March 2012; +0.7% year-on-year). Some others consumer prices increased also in March due to the end of the winter sales. The furniture prices went up by 1.6% (+0.9% year on year), those of sport equipment, camping and open-air recreation by 6.6% (+1.0% year on year), those of jewellery, clocks and watches by 1.1% (+3.8% year on year), those of travel goods by 2.1% (+2.2% year on year), those of perfumes and cosmetics by 0.4% (+1.1% year on year) as well as those of household appliances by 0.2% (—1.7% year on year). On the other hand, despite the end of the winter sales, the prices of audiovisual, photographic and information processing equipment continued to decline by 0.7% in March (—7.5% year on year) as did, to a lesser extend, health product prices (—0,1 % in March; —3.3% year on year).
tableauOLE_LINK2 – Detailed figures for various groups
| Items | Weight 2013 | Index Mar. 2013 | Month rate (%) | Annual rate (%) |
|---|---|---|---|---|
| a) All households - France | ||||
| All items (00 E) | 10000 | 127,43 | 0,8 | 1,0 |
| All items SA (00 C) | 10000 | 127,10 | 0,3 | 1,0 |
| Food (4000 E) | 1658 | 132,42 | 0,5 | 1,4 |
| Fresh food (4001 E) | 210 | 143,85 | 3,3 | 3,4 |
| Food excluding fresh products (4002 E) | 1448 | 130,81 | 0,1 | 1,2 |
| Tobacco (4034 E) | 206 | 241,56 | 0,0 | 7,0 |
| MANUFACTURED PRODUCTS (4003 E) | 2738 | 101,97 | 2,0 | 0,0 |
| Clothing and footwear (4004 E) | 458 | 110,42 | 12,2 | 0,7 |
| Medical products (4005 E) | 455 | 81,63 | –0,1 | –3,3 |
| Other manufactured products (4006 E) | 1825 | 104,95 | 0,2 | 0,6 |
| ENERGY (4007 E) | 822 | 181,94 | –0,2 | 1,0 |
| Petroleum products (4008 E) | 495 | 215,15 | –0,2 | –2,0 |
| SERVICES (4009 E) | 4576 | 133,30 | 0,4 | 1,2 |
| Actual rentals and services for dwellings (4010 E) | 748 | 140,10 | 0,2 | 2,0 |
| Medical services (4011 E) | 542 | 121,88 | 0,0 | 1,3 |
| Transport and communication services (4012 E) | 506 | 94,06 | 0,8 | –6,7 |
| Other services (4013 E) | 2780 | 143,12 | 0,4 | 2,5 |
| ALL ITEMS EXCLUDING RENTALS AND TOBACCO (5000 E) | 9202 | 125,12 | 0,8 | 0,8 |
| ALL ITEMS EXCLUDING TOBACCO (4018 E) | 9794 | 125,69 | 0,8 | 0,9 |
| b) Manual or clerical worker headed urban households - France | ||||
| ALL ITEMS EXCLUDING TOBACCO (4018 D) | 9704 | 125,42 | 0,8 | 0,8 |
| ALL ITEMS (00 D) | 10000 | 127,97 | 0,7 | 1,0 |
| c) Households that belong to the lowest equivalized disposable income quintile - France | ||||
| ALL ITEMS EXCLUDING TOBACCO (4018 Q) | 9674 | 126,77 | 0,8 | 0,7 |
- Source : Insee - Consumer Price Indexes
tableauTableau1English – Detailed figures for Core inflation* and HICP**
| Percentage change | ||||
|---|---|---|---|---|
| Items | Weight 2013 | Index Mar. 2013 | Month rate | Annual rate |
| All items "Core inflation" (4022 S) | 6085 | 122,21 | 0,4 | 0,7 |
| Food excluding fresh products, meat, milk and exotic products (4019 S) | 715 | 126,35 | 0,1 | 0,7 |
| Manufactured products (4020 S) | 2217 | 105,87 | 0,6 | 0,6 |
| Services including actual rentals and services for dwellings (4021 S) | 3153 | 137,28 | 0,4 | 0,8 |
| All items HICP (00 H) | 115,06 | 0,8 | 1,1 | |
- * ISJ : Core inflation indicator excludes public sector prices, the most volatile consumer prices and the tax measures. This index is seasonally adjusted. This index is calculated for all households in France excluding overseas departments and territories (base 100 1998).
- **HICP : Harmonised Indexes of Consumer Prices are inflation figures required under the Treaty on the functioning of the European Union. They are designed for international comparison of consumer price inflation between Member states of the Union. This index is calculated for all households in France (base 100 2005).
- Source : Insee - Consumer Price Indexes
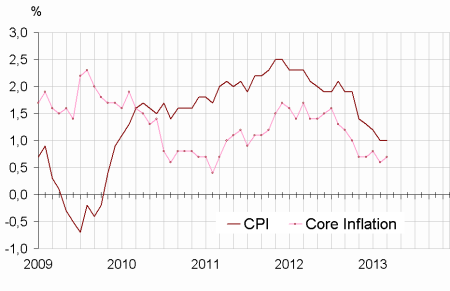
graphiqueGraphique1English – Consumer price index (IPC) and Core inflation (ISJ) – year on year changes
- Source : Insee - Consumer Price Indexes
Slight decline in the price of energy
In March 2013, energy prices decreased by 0.2% (+1.0% year on year) due to a decline in the price of petroleum products, also by 0.2% (—2.0% year on year). The drop in prices is more marked for heating fuels (—1.6%; —2.7% year on year) than for motor fuels (—0.1% in March and —2.3% year on year). Electricity prices were unchanged in March (+5.9% year on year) as did those of gas (+6.1% year on year) with, however, divergent evolutions for the price of city gas (—0,4 %) and for liquefied gas prices (+2.0%).
Seasonal increase in the service prices
Because of late winter holidays, the prices of some seasonal services rose further in March this year than last year. Thus, rents for holiday homes increased by 4.5% in March 2013 and by 2.6% year on year while they were stable in March 2012 (+2.3% year on year). The same applied to the package travel prices, they rose by 6.4% in March 2013 after + 6.5% in February (+2.6% and +9.8% respectively in March and February 2012) and to the hotels, cafes and restaurants (+1.0% in March 2013, like in February; +0.2% and +1.6% respectively in March and February 2012). Similarly, the air fares increased significantly in March 2013 (+5.2% after —2.7% in February 2013; +3.7% year on year) while they were almost stable last year (—0.1% in March 2012 after +1.6% in February 2012). These price increases were partly offset by the decline in the rates for insurance (—1.2%; +1.0% year on year) due to a sharp drop in the motor insurance charges proposed by some companies. Moreover, the decline in telecommunication prices continued in March (—0.3% ; —16.2% year on year).
Moderate increases in food prices
The downturn in food prices continued, their annual rate was +1,4% in March after + 1.7% in February and +2.1% in January. In March 2013, they went up by 0.5%, mainly as a result of the seasonal surge in prices of fresh foodstuffs (+3.3% ; +3.4% year on year). The prices of fresh vegetables grew by 4.4% in March (+0.1% year on year) and those of fresh fruit by 4.2% (+7.5% year on year). Excluding fresh products, the rise in food prices remained moderate (+0.1% in March; +1.2% year on year). The main upward contribution came from the prices of meat, growing by 0.3% in march and by 3.0% year on year, and from the prices of alcoholic beverages (+0.4%; +3.4% year on year), for the latter, linked with the hike in the excise duties from the 1st of January this year.
Core inflation stayed at a low level
Core inflation indicator (ISJ) increased by 0.4% in March 2013 (+0.7% year-on-year, after +0.6% in February). The Harmonized Index of Consumer Prices (HICP) rose by 0.8% (+1.1% year on year after +1.2 % in February and +1.4% in January).
Pour en savoir plus
