


 30 March 2012
2012- n° 82The public debt reached 1717.3 billion euros Debt of the general government according to the Maastricht definition - 4st Quarter
2011
30 March 2012
2012- n° 82The public debt reached 1717.3 billion euros Debt of the general government according to the Maastricht definition - 4st Quarter
2011
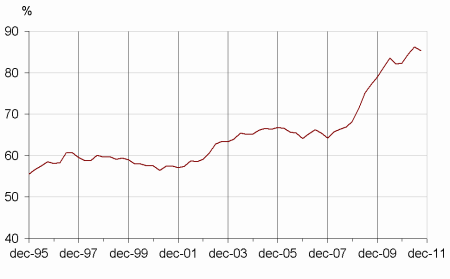
At the end of the fourth quarter of 2011, the public debt, which is a gross debt, reached 1717.3 billon euros, a 24.8 billion euros rise compared to Q3 2011. As a pourcentage of GDP, the debt amounted approximately to 85.8%, +0.3 point compared to Q3 2011. The growth of the general governement net debt was lower, a 22.4 billion rise compared to Q3 and represented approximately 78.6% of the GDP, +0.3 point compared to Q1 2011.
A strong increase of the public debt
At the end of the fourth quarter of 2011, the public debt, which is a gross debt, reached 1717.3 billon euros, a 24.8 billion euros rise compared to Q3 2011. As a pourcentage of GDP, the debt amounted approximately to 85.8%, +0.3 point compared to Q3 2011. The growth of the general governement net debt was lower, a 22.4 billion rise compared to Q3 and represented approximately 78.6% of the GDP, +0.3 point compared to Q1 2011.
graphiqueGraphIR_EN – Debt of the general government according to the Maastricht definition (% of GDP)
tableauTableau 1 – The debt of the general government according to the Maastricht definition at the end of Q3 2011 by sub-sector and by instrument category
| Q4 2010 | Q1 2011 | Q2 2011 | Q3 2011 | Q4 2011 | |
|---|---|---|---|---|---|
| General government | 1595,2 | 1650,0 | 1696,2 | 1692,5 | 1717,3 |
| % of GDP | 82,3% | 84,7% | 86,3% | 85,5% | 85,8% |
| of which, by sub-sector : | |||||
| State | 1245,0 | 1286,2 | 1338,7 | 1330,1 | 1335,2 |
| Central agencies | 14,1 | 11,0 | 9,8 | 9,9 | 10,4 |
| Local government | 161,1 | 157,2 | 154,3 | 153,4 | 166,3 |
| Social security funds | 175,0 | 195,7 | 193,4 | 199,1 | 205,4 |
| of which, by category : | |||||
| Currency and deposits | 23,2 | 26,2 | 28,0 | 30,6 | 30,1 |
| Securities other than shares | 1347,0 | 1407,2 | 1467,4 | 1457,9 | 1471,3 |
| of which : | |||||
| Short-term securities | 212,1 | 217,2 | 227,9 | 240,2 | 226,0 |
| Long-term securities | 1134,9 | 1189,9 | 1239,5 | 1217,7 | 1245,3 |
| Loans | 225,0 | 216,6 | 200,8 | 204,0 | 215,8 |
| of which : | |||||
| Short-term loans | 28,4 | 27,4 | 10,4 | 12,7 | 8,5 |
| Long-term loans | 196,6 | 189,2 | 190,4 | 191,2 | 207,3 |
- Source : National accounts - Insee, DGFiP, Banque de France
Pour en savoir plus
