


 23 October 2012
2012- n° 260In October 2012, the economic climate in services remains sluggish Monthly survey of services - October 2012
23 October 2012
2012- n° 260In October 2012, the economic climate in services remains sluggish Monthly survey of services - October 2012
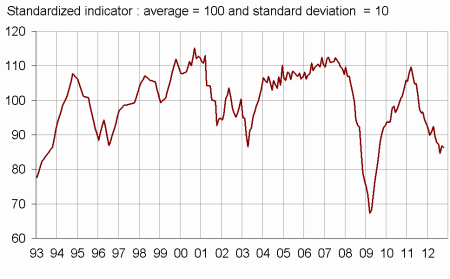
According to the business leaders surveyed in October 2012, the economic situation in services remains sluggish. The business climate synthetic indicator dropped by one point in October, and is 86, still below its long-term average (100). The turning point indicator stays in the neutral zone.
According to the business leaders surveyed in October 2012, the economic situation in services remains sluggish. The business climate synthetic indicator dropped by one point in October, and is 86, still below its long-term average (100). The turning point indicator stays in the neutral zone.
Business leaders consider that their activity remains degraded. They are pessimistic in their expectations of activity and demand for the coming months.
They consider that their operating balance result remains damaged over the last few months and anticipate a slight decline in the coming months.
The general outlook stays well below its long-term average.
Employment remains degraded
In services except temporary employment agencies, business leaders are more likely to report a decline in employement over the recent period. They remain pessimistic in their expectations for recruitment.
graphiqueGraph1 – Business climate synthetic indicator
graphiquegraph_retourn – Turning point indicator
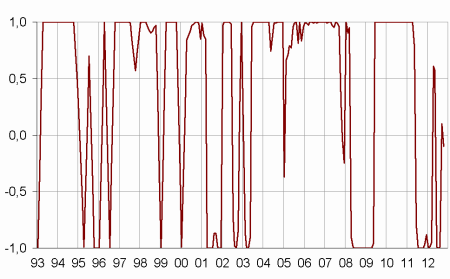
- Note: close to 1 (respectively -1), this indicator indicates a favourable short-term economic situation (respectively unfavourable).
tableauTable_quarter – Economic outlook in the services sector
| Average* | July 12 | Aug. 12 | Sept. 12 | Oct. 12 | |
|---|---|---|---|---|---|
| Business climate synthetic indicator | 100 | 87 | 85 | 87 | 86 |
| General outlook | –6 | –21 | –22 | –24 | –25 |
| Past activity | 3 | –13 | –11 | –16 | –12 |
| Expected activity | 3 | –9 | –13 | –6 | –6 |
| Expected demand | 1 | –9 | –15 | –13 | –13 |
| Business situation | 0 | –16 | –16 | –20 | –17 |
| Past selling prices | –3 | –7 | –8 | –10 | –9 |
| Expected selling prices | –1 | –5 | –8 | –7 | –11 |
| Past employment | 3 | –16 | –2 | –7 | –13 |
| except temporary work agencies | 1 | –6 | –4 | –7 | –9 |
| Expected employment | 3 | –4 | –8 | –5 | –6 |
| except temporary work agencies | 0 | –8 | –6 | –6 | –6 |
| Investments | |||||
| Past investments | 2 | –6 | –8 | –8 | –4 |
| Expected investments | 1 | –7 | –8 | –4 | –5 |
| Operating balance result | |||||
| Past result | –1 | –16 | –17 | ||
| Expected result | –1 | –14 | –16 | ||
| Cash position | –10 | –15 | –14 | ||
| Difficulties of supply and demand | |||||
| difficulties of supply and demand | 9 | 11 | 11 | ||
| difficulties of supply only | 23 | 21 | 18 | ||
| difficulties of demand only | 30 | 40 | 41 | ||
| Difficulties in recruitment | 30 | 19 | 20 |
- * Average of the balances of opinion since 1988
- Source: Insee
Documentation
Methodology (2016) (pdf,158 Ko)
Pour en savoir plus
Time series : Economic outlook surveys – Services
