


 27 December 2012
2012- n° 318At the end of Q3 2012, the public debt reaches 1 818.1 billion euros Debt of the general government according to the Maastricht definition - 3rd Quarter
2012
27 December 2012
2012- n° 318At the end of Q3 2012, the public debt reaches 1 818.1 billion euros Debt of the general government according to the Maastricht definition - 3rd Quarter
2012
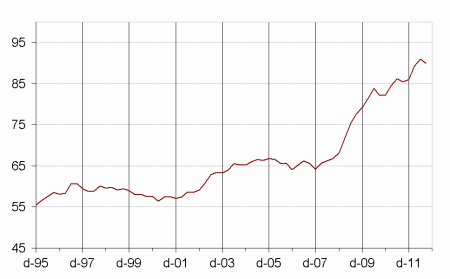
At the end of Q3 2012, public Maastricht debt, which is a gross debt, reached €1818.1bn, a €14.5bn fall in comparison to Q2 2012. As a percentage of GDP, it reached 89.9 %, 1.1 point lower than the Q2 2012 peak. Nonetheless, the net public debt rose by €24.0bn.
The public debt decreased by €14,5bn during the third quarter of 2012…
At the end of Q3 2012, public Maastricht debt, which is a gross debt, reached €1818.1bn, a €14.5bn fall in comparison to Q2 2012. As a percentage of GDP, it reached 89.9 %, 1.1 point lower than the Q2 2012 peak. Nonetheless, the net public debt rose by €24.0bn.
…driven by a fall in the State’s debt…
Central Government contribution to debt went down by €13.8bn in the third quarter. The State paid back short-term treasury bills (-€7.6bn) and medium-term bonds (-€15.7bn) but issued long-term bonds for a net value of €7.4bn. The Trésor deposit liabilities went up by €1.5bn and the State borrowed €0.6bn on behalf of the EFSF. On the asset side, cash positions accumulated during the first half of 2012 significantly shrunk (-€30.7bn).
Central government agencies (Odac) contribution to debt remained steady (+€0.1bn).
…and more moderately by a reduction in social security funds debt.
Social security funds contribution to debt declined by €1.1bn. Cades went out of €8.5bn debt : it paid back €10.9bn of short-term bills and €1.9bn of long-term loans, but issued €4.0bn of medium-term and long-term bonds. Unedic and Acoss issued treasury bills for respectively €4.3bn and €2.5bn. Hospitals and MSA both increased their debt by €0.4bn.
Local government contribution to debt slightly increased by €0.4bn. This evolution is comparable to those observed during previous years at the same period.
graphiqueGraphIR – General government debt under the Maastricht criteria (% of GDP) (*)
tableauTableauA – General government debt according to the Maastricht criteria at the end of Q3 2012 by sub-sector and by instrument category
| 2011Q3 | 2011Q4 | 2012Q1 | 2012Q2 | 2012Q3 | |
|---|---|---|---|---|---|
| General government | 1692,2 | 1717,0 | 1789,4 | 1832,6 | 1818,1 |
| % of GDP | 85,4% | 86,0% | 89,3% | 91,0% | 89,9% |
| of which, by sub-sector : | |||||
| State | 1330,0 | 1335,1 | 1381,9 | 1433,2 | 1419,4 |
| Central agencies | 9,9 | 10,4 | 10,0 | 9,7 | 9,8 |
| Local government | 153,4 | 166,3 | 160,9 | 161,3 | 161,7 |
| Social security funds | 199,0 | 205,2 | 236,6 | 228,4 | 227,3 |
| of which, by category : | |||||
| Currency and deposits | 30,5 | 30,0 | 31,5 | 30,7 | 32,3 |
| Securities other than shares | 1457,7 | 1471,2 | 1540,1 | 1571,3 | 1556,2 |
| short-term | 240,2 | 226,0 | 236,1 | 225,6 | 214,1 |
| long-term | 1217,5 | 1245,1 | 1304,0 | 1345,6 | 1342,1 |
| Loans | 203,9 | 215,8 | 217,8 | 230,6 | 229,7 |
| short-term | 12,7 | 8,5 | 10,0 | 11,8 | 9,0 |
| long-term | 191,2 | 207,2 | 207,8 | 218,8 | 220,6 |
- (*) Explanations in the box « For more details »
- Source : National Accounts 2005 basis - Insee, DGFiP, Banque de France
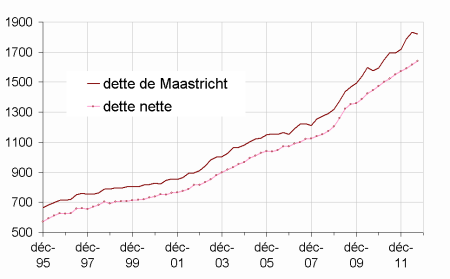
The net public debt still increases
At the end of Q3 2012, the net public debt peaked at €1 640.2bn (amounting to 81.1 % of GDP vs. 80.3 % in the previous quarter), a €24.0bn increase compared to the previous quarter. The €38,4bn gap between changes in net and gross debt is explained by the strong decline of central government and social security funds cash reserves (respectively -€30.7bn and -€9.4bn). Other assets held by public administrations have gone up : central agencies bank deposits increased by €0.3bn, the State granted €0.6bn in long-term loans to Portugal within the EFSF framework and FRR acquired €0.8bn of securities other than shares.
tableauTableauB – The net public debt and its sub-sector decomposition
| 2011Q3 | 2011Q4 | 2012Q1 | 2012Q2 | 2012Q3 | |
|---|---|---|---|---|---|
| General government | 1550,1 | 1572,6 | 1590,5 | 1616,2 | 1640,2 |
| of which : | |||||
| State | 1266,3 | 1271,0 | 1287,7 | 1312,7 | 1329,1 |
| Central agencies | –4,5 | –1,7 | –2,3 | –2,7 | –3,0 |
| Local government | 143,7 | 156,6 | 151,1 | 151,5 | 151,9 |
| Social security funds | 144,7 | 146,6 | 153,9 | 154,8 | 162,2 |
graphiqueGraph_dette_nette – Debt according to Maastricht definition and net debt
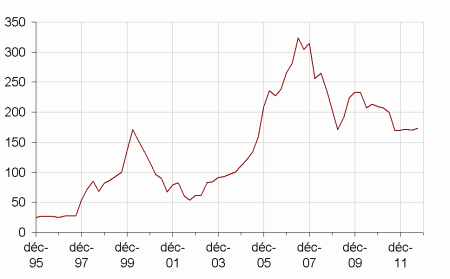
The value of quoted shares and mutual fund shares remains stable
At the end of Q3 2012, the value of quoted shares and mutual fund shares held by general government reached €173.3bn, a €3.6bn rise from the end of Q2. The amount of quoted shares held by the State fell by €3.0bn, linked to energy companies stock prices. The value of quoted shares and mutual fund shares held by social security funds increased by €6.5 bn, mostly thanks to purchases : Unedic bought €3.9bn of mutual fund shares, FRR purchased €2.2bn of mutual fund shares and €0.3bn of quoted shares whereas the RSI sold €1.3bn of mutual fund shares and acquired €0.8bn of quoted shares.
tableauTableauC – Quoted shares and mutual fund shares held by general government
| 2011Q3 | 2011Q4 | 2012Q1 | 2012Q2 | 2012Q3 | |
|---|---|---|---|---|---|
| General government | 169,5 | 169,7 | 171,2 | 169,6 | 173,2 |
| of which : | |||||
| State | 65,4 | 59,1 | 56,2 | 55,7 | 52,6 |
| Central agencies | 23,2 | 22,2 | 24,4 | 23,6 | 23,8 |
| Local government | 0,6 | 0,6 | 0,6 | 0,6 | 0,6 |
| Social security funds | 80,5 | 87,8 | 89,9 | 89,7 | 96,2 |
graphiqueGraph_F5 – Quoted shares and mutual fund shares held by general government
Pour en savoir plus
