


 16 May 2013
2013- n° 111In 2013, investment in the manufacturing industry, would decrease by4 % compared to
2012, according to business Industrial investment survey - April 2013
16 May 2013
2013- n° 111In 2013, investment in the manufacturing industry, would decrease by4 % compared to
2012, according to business Industrial investment survey - April 2013
Surveyed in April 2013, business managers report that investment in manufacturing industry increased by 7% in 2012 comparing to 2011. They revised 5 point upwards their estimation given last January.
Surveyed in April 2013, business managers report that investment in manufacturing industry increased by 7% in 2012 comparing to 2011. They revised 5 point upwards their estimation given last January.
For 2012, industrials still anticipate a decrease of investment
In April, business leaders in manufacturing industry forecast an decrease by 4 % of investment comparing to 2012. In january, they estimed it would stay stable.
tableauTab1_ang – Real annual investment growth
%
| NA* : (A17) and [A38] | 2012 | 2013 | ||
|---|---|---|---|---|
| estimate Jan.13 | observed Apr.13 | estimate Jan.13 | estimate Apr.13 | |
| MANUFACTURING INDUSTRY | 2 | 7 | 0 | –4 |
| (C1): Manufacture of food products and beverages | 5 | 8 | 6 | 2 |
| (C3): Electrical and electronic equipment; machine equipment | –9 | –5 | 9 | 3 |
| (C4): Manufacture of transport equipment | 13 | 20 | –10 | –12 |
| [CL1]: Motor vehicles | 20 | 22 | –21 | –20 |
| (C5): Other manufacturing | –2 | 2 | 0 | –5 |
| Total sectors C3-C4-C5 | 0 | 5 | –1 | –6 |
- How to read this table : In manufacturing industry, firms surveyed in April 2013 observed an increase by 7% of their nominal investment in 2012 comparing to 2011 and forecast an decrease of 4% in 2013 comparing to 2012.
- * The codes correspond to the level of aggregation (A17) and [A38] of the "NA" aggregate classification based on NAF rev.2.
tableauTab2_ang – Share of purposes of investment
%
| Average | 2012 | 2013 | |
|---|---|---|---|
| 1991-2012 | observed | forecast | |
| Replacement | 27 | 29 | 30 |
| Modernization, streamlining | 24 | 26 | 24 |
| of which : automation | 11 | 10 | 9 |
| of which : new production methods | 7 | 7 | 7 |
| of which : energy savings | 6 | 9 | 8 |
| increase in productive capacity | 16 | 13 | 13 |
| Introduction of new products | 14 | 12 | 12 |
| Other purposes (safety, environment, working conditions…) | 20 | 20 | 21 |
tableauTab3a_ang – Productive capacity and equipment scrapping
* balance of opinion, as % of responses - ** %
| Observed | Forecast | |||
|---|---|---|---|---|
| aver. | in 2012 | aver. | for 2013 | |
| Change in productive capacity* | 31 | 14 | 32 | 16 |
| Change in equipment scrapping* | 19 | 13 | –2 | 2 |
| Share of enterprises reporting equipment scrapping* | 77 | 67 | 76 | 66 |
| Breakdown of enterprises reporting equipment scrapping** | ||||
| Wear and tear, obsolescence | 51 | 59 | 48 | 54 |
| Installation of more efficient equipment | 31 | 27 | 33 | 30 |
| Shut-down of capacity for old products | 12 | 12 | 12 | 15 |
| Other scrapping | 5 | 2 | 6 | 1 |
| Total | 100 | 100 | 100 | 100 |
graphiqueGraph2_ang – Six-month change in investment (first estimation*)
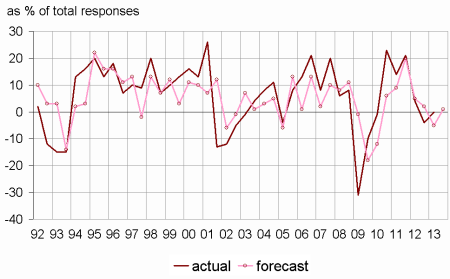
- * See technical note "A new six-month change estimation", Information Rapide Survey of Industrial Investment - July 2010
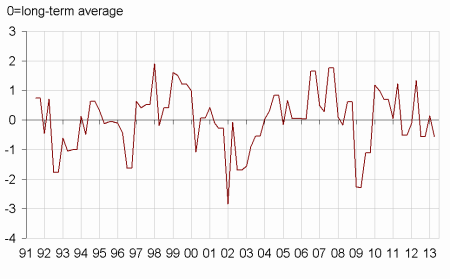
graphiqueGraphIR_ang – Investment revision indicator *
Documentation
Methodology (pdf,34 Ko)
Pour en savoir plus
: bureau-de-presse@insee.fr
Time series : Industry – Investment
