


 31 August 2012
2012- n° 214Overall producer prices of agricultural products increased in July 2012 Indices of agricultural prices - July 2012
31 August 2012
2012- n° 214Overall producer prices of agricultural products increased in July 2012 Indices of agricultural prices - July 2012
In July, overall producer prices of agricultural products increased by 3 % compared to June; year-over-year they rose by 5.8 %
In July, overall producer prices of agricultural products increased by 3 % compared to June; year-over-year they rose by 5.8 %
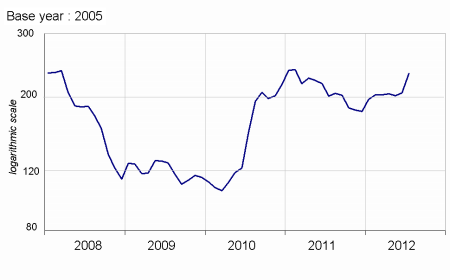
Price of cereals jumped between June and July (+14.2 %) due to a decrease in world production this season, caused by the drought which has been going on for three months in the United States and in the Black Sea region.
graphiquecereal – Producer price of cereals
Price of oleaginous rose noticeably in July (+6.0 %). The demand for rape was strong whereas the stocks were depleted in Europe until the next harvest. It is partly sustained by the rise in oil price which makes the manufacturing of agrofuel attractive.
Potato price fell in July year-over-year (–31.0 %), the last harvest in North-West Europe having been profuse.
Price of wine decreased slightly in July (-1.1 %).
Price of fresh fruits increased in July year-over-year (+6.1 %). Peach became more expensive as a result of a decreasing supply compared with the previous season: the surface area devoted to its production was reduced and bad weather this spring spoiled some fruits. On the other hand, price of apricot lowered: the production was on the rise despite local damage due to thunderstorms.
graphiquevegetable – Producer price of fresh vegetables
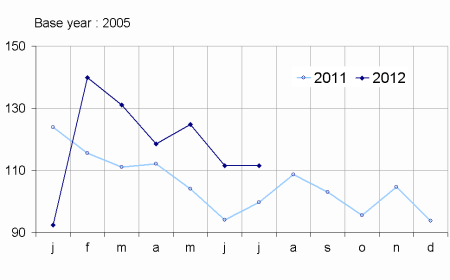
Price of fresh vegetables was higher in July year-over-year (+11.9 %). Heavy rains at the beginning of the spring deteriorated salad plants. Price of tomatoes rose too, as a result of a decreasing national production and moderate foreign competition. The market was balanced for cucumber, contrary with the previous season during which a health warning had made the consumers turn aside from it. On the other hand price of melon decreased: the dull weather during July did not encourage the consumption.
graphiquepig – Producer price of pigs and large cattle
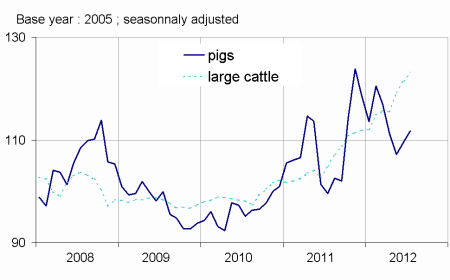
On a seasonally adjusted basis, price of animals went up in July (+1.2 %). Price of big cattle kept up rising, showing a rise approaching 20 % year-over-year, due to a gradual reduction of livestock. Price of poultry partly reflected the increase in price of feed. The demand for pigs was high, most notably for export. Price of calves decreased slightly, with the French consumption tendentially decreasing.
tableauTab1 – Indices of producer prices of agricultural products (IPPAP)
| Variation as % over : | |||||
|---|---|---|---|---|---|
| weights | July 2012 | a month | weights | June 2012 | |
| raw | seasonally adjusted data | raw | |||
| Agricultural goods output | 1000 | 136.8 | +3.0 | +3.6 | +5.8 |
| excluding fruits and vegetables | 878 | 139.7 | +3.7 | +4.2 | +5.5 |
| Crop output (excluding fruits and vegetables) | 417 | 154.4 | +6.5 | +6.6 | +5.1 |
| Cereals | 115 | 230.8 | +14.2 | +14.9 | +16.7 |
| of which soft wheat | 63 | 247.4 | +15.0 | +19.3 | +25.6 |
| grain maize | 27 | 205.1 | +13.9 | +10.4 | +7.1 |
| Potatoes | 19 | 116.5 | /// | /// | –31.0 |
| Wines | 161 | 120.5 | -1.1 | -0.9 | –2.1 |
| quality wines | 140 | 119.4 | –1.1 | –0.8 | –2.0 |
| other wines | 21 | 127.4 | –1.0 | –1.8 | –2.8 |
| Oleaginous | 28 | 229.2 | +6.0 | +1.2 | +14.4 |
| Horticultural products | 51 | 101.9 | +3.4 | –3.3 | –0.3 |
| Other crop products | 43 | 107.6 | +2.1 | +2.7 | –0.3 |
| Fruits and vegetables (1) | 122 | 115.8 | /// | /// | +8.8 |
| Fresh vegetables | 61 | 111.5 | /// | /// | +11.9 |
| Fresh fruits | 39 | 129.1 | /// | /// | +6.1 |
| Animal output | 461 | 126.3 | +0.7 | +1.6 | +6.0 |
| Animals | 286 | 123.1 | +1.2 | +3.1 | +9.0 |
| of which large cattle | 108 | 123.6 | +1.3 | +6.6 | +18.6 |
| calves | 29 | 118.0 | –0.3 | –1.0 | +3.0 |
| pigs | 64 | 120.3 | +2.1 | +0.4 | +12.2 |
| sheep | 14 | 110.8 | +1.0 | –0.5 | –0.1 |
| poultry | 59 | 137.6 | +0.8 | +2.6 | –1.5 |
| of which chicken | 26 | 136.5 | +0.7 | +2.4 | –1.6 |
| Milk | 159 | 121.6 | +0.0 | +3.1 | –3.3 |
| of which cow milk (2) | 148 | 122.8 | +0.0 | +3.4 | –3.5 |
| Eggs | 13 | 254.3 | +0.8 | –17.7 | +45.2 |
- (1) Including vegetables for industry.
- (2) The price for July is not yet known and therefore is estimated by carrying forward the seasonally adjusted price of June.
- Sources: INSEE - SSP (department of Agriculture)
Purchase price of the means of agricultural production increased in July
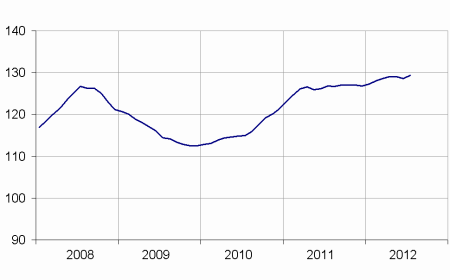
The price of intermediate consumptions rose over one month (+0.8 %) as a result of higher prices for energy and animal feeding stuffs. Price of investment was stable. Year-over-year, purchase price increased by 2.1 %, but in a more diffuse way.
graphiqueMoyens_prod – Purchase price of the means of agricultural production
tableauTab2 – Indices of purchase prices of the means of agricultural production (IPAMPA)100=2005
| weights | July 2012 | Variation as % over | |||
|---|---|---|---|---|---|
| a month | |||||
| Total input | 1000 | 129.4 | +0.6 | +0.3 | +2.1 |
| Goods and services currently consumed in agriculture | 758 | 132.4 | +0.8 | +0.3 | +2.4 |
| Energy (1) | 84 | 145.5 | +2.4 | –6.8 | +2.8 |
| Seeds | 51 | 117.4 | +0.1 | +0.5 | +3.5 |
| Fertilisers and soil improvers | 92 | 164.6 | +0.1 | –1.4 | +2.9 |
| Plant protection products | 77 | 106.6 | 0.0 | +0.3 | +0.6 |
| Animal feeding stuffs | 189 | 146.2 | +1.5 | +4.5 | +2.7 |
| Veterinary expenses | 38 | 117.7 | 0.0 | +0.2 | +2.6 |
| Small equipment and tools | 14 | 112.1 | +0.2 | +1.5 | +0.9 |
| Maintenance of materials | 56 | 130.0 | +0.4 | +1.5 | +3.4 |
| Maintenance of buildings | 9 | 124.2 | 0.0 | 0.0 | +2.2 |
| Other goods and services | 149 | 113.3 | +0.3 | +0.3 | +1.1 |
| Goods and services contributing to investment | 242 | 119.9 | 0.0 | +0.1 | +1.1 |
| Material | 170 | 116.8 | 0.0 | +0.1 | +0.8 |
| Tractors | 71 | 113.5 | 0.0 | 0.0 | +0.9 |
| Machinery and plant for cultivation | 36 | 119.2 | 0.0 | +0.2 | –1.1 |
| Machinery and plant for harvesting | 37 | 117.3 | 0.0 | +0.1 | +1.4 |
| Utility vehicles | 16 | 113.9 | 0.0 | 0.0 | +2.1 |
| Buildings | 72 | 127.3 | 0.0 | 0.0 | +1.7 |
- (1) The repayment of 5 cents per litre of fuel of the domestic tax on energetical products (TICPE) benefiting farmers has been applied in advance for the year 2012
- Sources: INSEE - SSP (department of Agriculture)
Documentation
Methodology (pdf,122 Ko)
Pour en savoir plus
Time series : Indices of agricultural prices
