


 31 July 2012
2012- n° 194Overall producer prices of agricultural products were stable in June 2012 Indices of agricultural prices - June 2012
31 July 2012
2012- n° 194Overall producer prices of agricultural products were stable in June 2012 Indices of agricultural prices - June 2012
In June, overall producer prices of agricultural products were stable compared to May ; year-over-year they increased by 1.5 %
In June, overall producer prices of agricultural products were stable compared to May ; year-over-year they increased by 1.5 %
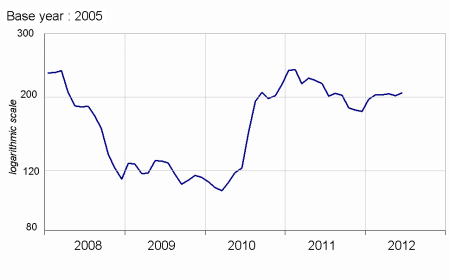
Price of cereals rose between May and June (+1.9 %). The price of wheat showed a sharper rise (+3.9 %). The drought - which has been going since May - in the United States and in the Black Sea region led to smaller harvests than those initially forecast.
graphiquecereal – Producer price of cereals
Oleaginous price decreased in June (-1.3 %). Price of rape was stable, whereas sunflower depreciated (–5.7 %) as soon as a record global harvest was forecast.
Potato price fell in June year-over-year (–29.8 %), the last harvest in North-West Europe having been profuse.
Price of wine decreased slightly in June (-0.5 %).
Price of fresh fruits rose in June year-over-year (+9.3 %). On the supply side, bad weather damaged cherry crops ; it also caused lower yields for peach, whose surface area devoted to its production was, moreover, reduced. On the other hand, apricot output is expected to be higher that last year, with a decreasing price. On the demand side, the dull weather affected the consumption of strawberries whose price went down too.
graphiquevegetable – Producer price of fresh vegetables
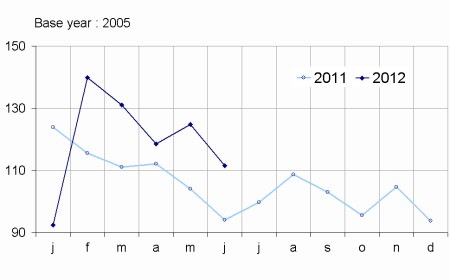
The price of fresh vegetables was higher in June year-over-over (+18.5 %) : heavy rains at the beginning of this spring had damaged salad plants, and the foreign competition is moderate for cucumbers, tomatoes and carrots. On the demand side, the dull weather favoured on the consumption of carrots, but also cabbage and leek, which is usually lower at this time of the year.
graphiquepig – Producer price of pigs and large cattle
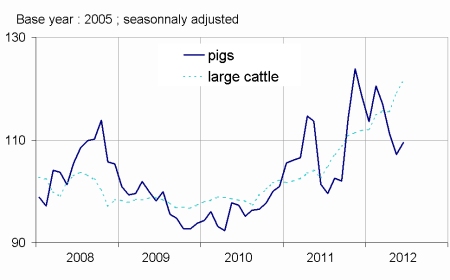
On a seasonally adjusted basis, price of animals rose in June (+1.4 %). Price of big cattle kept increasing, showing an increase approaching 20% year-over-year, due to a progressive cut of livestock. Price of pigs picked up again, driven up by the exports to Asia. On the other hand, price of calves staggered, with the French consumption tendentially decreasing. Egg prices kept decreasing (-11.3 % over one month) : the supply is catching up following the implementation of a new standard size for hen houses which had led to a loss of production capacity.
tableauTab1 – Indices of producer prices of agricultural products (IPPAP)
| Variation as % over : | |||||
|---|---|---|---|---|---|
| weights | June 2012 | a month | 3 months | a year | |
| raw | seasonally adjusted data | raw | |||
| Agricultural goods output | 1000 | 131.4 | 0.0 | –1.5 | +1.5 |
| excluding fruits and vegetables | 878 | 133.1 | +0.3 | –1.4 | +0.2 |
| Crop output (excluding fruits and vegetables) | 417 | 145.9 | +0.5 | +0.9 | –4.1 |
| Cereals | 115 | 202.1 | +1.9 | +1.4 | –6.2 |
| of which soft wheat | 63 | 215.1 | +3.9 | +3.6 | –1.9 |
| grain maize | 27 | 180.1 | +0.3 | –0.7 | –13.0 |
| Potatoes | 19 | 120.4 | /// | /// | –29.8 |
| Wines | 161 | 121.7 | –0.5 | +0.7 | +0.2 |
| quality wines | 140 | 120.6 | –0.4 | +0.9 | +0.8 |
| other wines | 21 | 128.8 | –1.0 | –0.4 | –3.2 |
| Oleaginous | 28 | 216.3 | –1.3 | +0.2 | +2.0 |
| Horticultural products | 51 | 100.8 | +0.1 | –4.6 | –3.1 |
| Other crop products | 43 | 105.4 | –0.4 | +1.9 | –1.9 |
| Fruits and vegetables (1) | 122 | 119.3 | /// | /// | +13.1 |
| Fresh vegetables | 61 | 111.4 | /// | /// | +18.5 |
| Fresh fruits | 39 | 137.6 | /// | /// | +9.3 |
| Animal output | 461 | 121.5 | +0.1 | –3.9 | +5.4 |
| Animals | 286 | 121.7 | +1.4 | +0.7 | +8.1 |
| of which large cattle | 108 | 122.0 | +1.9 | +5.1 | +19.8 |
| calves | 29 | 118.5 | –0.1 | –2.1 | +3.5 |
| pigs | 64 | 116.6 | +2.2 | –6.5 | +8.0 |
| sheep | 14 | 110.8 | –2.4 | –3.2 | –2.8 |
| poultry | 59 | 136.5 | +0.8 | +2.4 | –2.3 |
| of which chicken | 26 | 135.5 | +0.7 | +2.6 | –2.1 |
| Milk | 159 | 110.4 | 0.0 | –6.4 | –7.5 |
| of which cow milk (2) | 148 | 111.1 | 0.0 | –6.9 | –8.0 |
| Eggs | 13 | 252.4 | –11.3 | –28.0 | +105.5 |
- (1) Including vegetables for industry.
- (2) The price for June is not yet known and therefore is estimated by carrying forward the seasonally adjusted price of May.
- Sources: INSEE - SSP (department of Agriculture)
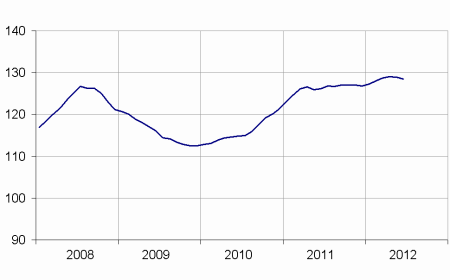
Purchase price of the means of agricultural production decreased slightly in june.
The price of intermediate consumptions went down slightly in June due to lower energy prices. Price of investments was stable. However, purchase prices increased year-over-year, most notably for seeds and fertilisers (more than 4 %).
graphiqueMoyens_prod – Purchase price of the means of agricultural production
tableauTab2 – Indices of purchase prices of the means of agricultural production (IPAMPA)
| weights | June 2012 | Variation as % over | |||
|---|---|---|---|---|---|
| a month | 3 months | a year | |||
| Total input | 1000 | 128.5 | –0.3 | –0.1 | +1.8 |
| Goods and services currently consumed in agriculture | 758 | 131.3 | –0.4 | –0.2 | +2.1 |
| Energy (1) | 84 | 142.1 | –5.4 | –10.4 | +2.4 |
| Seeds | 51 | 117.2 | +0.4 | +0.7 | +4.1 |
| Fertilisers and soil improvers | 92 | 164.4 | –0.7 | –1.2 | +4.2 |
| Plant protection products | 77 | 106.6 | –0.1 | +0.9 | +0.6 |
| Animal feeding stuffs | 189 | 144.0 | +0.9 | +4.4 | +0.8 |
| Veterinary expenses | 38 | 117.8 | +0.1 | +0.5 | +2.7 |
| Small equipment and tools | 14 | 111.7 | +0.8 | +1.7 | +1.0 |
| Maintenance of materials | 56 | 129.5 | +0.6 | +1.1 | +3.1 |
| Maintenance of buildings | 9 | 123.8 | 0.0 | 0.0 | +2.1 |
| Other goods and services | 149 | 112.8 | +0.2 | 0.0 | +1.5 |
| Goods and services contributing to investment | 242 | 119.8 | 0.0 | +0.2 | +1.1 |
| Material | 170 | 116.8 | 0.0 | +0.3 | +1.0 |
| Tractors | 71 | 113.5 | 0.0 | +0.1 | +1.1 |
| Machinery and plant for cultivation | 36 | 119.2 | 0.0 | +0.2 | –0.9 |
| Machinery and plant for harvesting | 37 | 117.3 | –0.1 | +0.6 | +1.4 |
| Utility vehicles | 16 | 113.9 | 0.0 | +0.2 | +2.1 |
| Buildings | 72 | 127.0 | 0.0 | 0.0 | +1.5 |
- (1) The repayment of 5 cents per litre of fuel of the domestic tax on energetical products (TICPE) benefiting farmers has been applied in advance for the year 2012
- Sources: INSEE - SSP (department of Agriculture)
Documentation
Methodology (pdf,122 Ko)
Pour en savoir plus
Time series : Indices of agricultural prices
