


 15 May 2013
2013- n° 108French GDP decreased again in Q1 2013 (-0.2%) Quarterly national accounts - second estimate - 1st Quarter 2013
15 May 2013
2013- n° 108French GDP decreased again in Q1 2013 (-0.2%) Quarterly national accounts - second estimate - 1st Quarter 2013
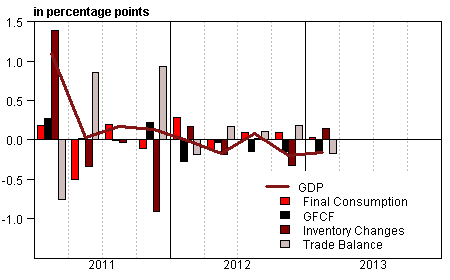
In Q1 2013, French growth domestic product (GDP) in volume* decreased again: –0.2% after –0.2% in Q4 2012. It is the third decrease in the last four quarters.
In Q1 2013, French growth domestic product (GDP) in volume* decreased again: –0.2% after –0.2% in Q4 2012. It is the third decrease in the last four quarters.
Household consumption expenditure was almost stable (–0.1% after 0.0%), meanwhile gross fixed capital formation (GFCF) was still diminishing (–0.9% after –0.8%). Overall, total domestic expenditure (excluding change in inventories) slightly decreased, weighing down GDP growth by –0.1 point.
Exports declined (–0.5% after –0.7%), while imports reached near stability (+0.1% after –1.3%). Therefore, foreign trade balance weighed down GDP (–0.2 point, after +0.2 point). Conversely, changes in inventories contributed positively to GDP: +0.1 point, after –0.3 point in Q4 2012.
Total output was at a standstill
In Q1 2013, output of in goods and services almost stabilized (–0.1% after –0.4%). Production in manufactured goods slowly decreased (–0.3% after –2.2%): output in transport equipment (–2.1% after –5.4%), and food products (–1.1% after –0.1%) sharply diminished whereas output in coke and refined petroleum upturned (+5.6% after –8.0%). Output in tradable services was flat (0.0% after +0.1%), but construction output went down again (–0.8% after –0.9%).
Household consumption expenditure remained sluggish
In Q1 2013, household consumption expenditure was almost flat (–0.1% after 0.0%) despite a rebound in energy, water and waste (+5.0% after –0.4%) due to a cold winter. Conversely, expenditure on manufactured goods was weakening (–0.9% after +0.1%), especially car purchases (–5.8% after 0.0%). Moreover, consumption of services remained sluggish (–0.1% after +0.2%).
graphiqueGraph1 – GDP and its main components
tableauTab1 – GOODS AND SERVICES: SUPPLY AND USES CHAIN-LINKED VOLUMES
| 2012 Q2 | 2012 Q3 | 2012 Q4 | 2013 Q1 | 2012 | 2013 (ovhg) | |
|---|---|---|---|---|---|---|
| GDP | -0.2 | 0.1 | -0.2 | -0.2 | 0.0 | -0.3 |
| Imports | 0.2 | 0.1 | -1.3 | 0.1 | -0.9 | -0.7 |
| Household consumption *expenditure | -0.4 | 0.0 | 0.0 | -0.1 | -0.4 | -0.2 |
| General government's *consumption expenditure | 0.5 | 0.3 | 0.3 | 0.3 | 1.4 | 0.8 |
| GFCF | -0.2 | -0.7 | -0.8 | -0.9 | -1.2 | -1.8 |
| *of which Non financial corporated and unincorporated enterprises | -0.2 | -0.9 | -0.7 | -0.8 | -1.9 | -1.9 |
| Households | -0.2 | -0.3 | -0.8 | -1.3 | -0.4 | -2.1 |
| General government | 0.2 | -0.5 | -0.9 | -0.7 | -0.6 | -1.6 |
| Exports | 0.9 | 0.5 | -0.7 | -0.5 | 2.5 | -0.6 |
| Contributions : | ||||||
| Internal demand excluding inventory changes | -0.2 | 0.0 | -0.1 | -0.1 | -0.1 | -0.2 |
| Inventory changes | -0.2 | 0.0 | -0.3 | 0.1 | -0.8 | -0.1 |
| Net foreign trade | 0.2 | 0.1 | 0.2 | -0.2 | 1.0 | 0.1 |
tableauTab2 – Sectoral accounts
| 2012 Q2 | 2012 Q3 | 2012 Q4 | 2013 Q1 | 2012 | 2013 (ovhg) | |
|---|---|---|---|---|---|---|
| Profit ratio of NFC* (level) | 28.5 | 28.5 | 27.9 | 28.3 | ||
| Household purchasing power | 0.2 | -0.1 | -0.9 | -0.9 | -0.6 |
- *NFC: non-financial corporations
tableauTab3 – GDP and components : prices indices
| 2012 Q2 | 2012 Q3 | 2012 Q4 | 2013 Q1 | 2012 | 2013 (ovhg) | |
|---|---|---|---|---|---|---|
| GDP | 0.5 | 0.3 | 0.3 | 0.7 | 1.5 | 1.2 |
| Imports | 0.2 | 0.1 | 0.3 | -0.7 | 1.9 | -0.4 |
| Cons. Exp. : | ||||||
| - Households | 0.2 | 0.1 | 0.2 | 0.3 | 1.9 | 0.6 |
| - GG* | 0.2 | 0.3 | 0.2 | 0.2 | 1.1 | 0.5 |
| Total GFCF | 0.4 | 0.0 | 0.1 | 0.5 | 1.7 | 0.7 |
| - of which Households | 0.8 | -0.4 | -0.1 | 0.5 | 2.3 | 0.4 |
| - of which NFE | 0.2 | 0.1 | 0.2 | 0.6 | 1.3 | 0.9 |
| - of which GG | 0.3 | 0.4 | 0.4 | 0.3 | 2.2 | 0.9 |
| Exports | -0.4 | 0.7 | 0.3 | -0.1 | 1.2 | 0.4 |
- *GG: General Government
tableauTab4 – Manufactured goods : supply and uses in volume
| 2012 Q2 | 2012 Q3 | 2012 Q4 | 2013 Q1 | 2012 | 2013 (ovhg) | |
|---|---|---|---|---|---|---|
| Industrie’s production | -1.3 | 0.8 | -2.2 | -0.3 | -2.8 | -1.8 |
| - of which value added | -0.9 | 0.5 | -1.8 | -0.7 | -2.0 | -2.0 |
| Imports | 1.6 | -1.1 | -1.5 | 0.2 | 0.3 | -1.1 |
| Intermediate uses | -0.9 | 0.3 | -1.2 | -0.5 | -1.8 | -1.4 |
| Cons. Exp. : | ||||||
| - of households | -0.8 | 0.4 | -0.1 | -0.9 | -1.2 | -1.0 |
| - of GG | 0.7 | 0.3 | 1.5 | 1.5 | 4.3 | 2.9 |
| Total GFCF | -0.9 | -0.6 | -1.8 | -1.3 | -3.0 | -3.1 |
| - of which NFC | -0.9 | -0.7 | -2.0 | -1.5 | -3.7 | -3.6 |
| - of which GG | -0.5 | -0.3 | -0.1 | 0.0 | 1.0 | -0.4 |
| Exports | 0.9 | 0.5 | -1.5 | -0.4 | 3.0 | -1.1 |
| Inventory changes (contribution) | 0.1 | -0.5 | -0.8 | 0.9 | -2.5 | 0.1 |
tableauTab5 – Households’ disposable income and ratios of households’ account
| 2012 Q2 | 2012 Q3 | 2012 Q4 | 2013 Q1 | 2012 | 2013 (ovhg) | |
|---|---|---|---|---|---|---|
| HDI | 0.4 | 0.0 | -0.7 | 0.9 | -0.4 | |
| Household purchasing power | 0.2 | -0.1 | -0.9 | -0.9 | -0.6 | |
| HDI by cu* (purchasing power) | 0.0 | -0.2 | -1.0 | -1.5 | -0.9 | |
| Adjusted HDI (purchasing power) | 0.2 | 0.0 | -0.6 | -0.4 | -0.4 | |
| Saving rate (level) | 16.0 | 15.9 | 15.2 | 15.6 | ||
| Financial saving rate (level) | 6.5 | 6.5 | 5.8 | 6.2 |
- *cu: consumption unit
tableauTab6 – Ratios of non-financial corporations’ account
| 2012 Q2 | 2012 Q3 | 2012 Q4 | 2013 Q1 | 2012 | |
|---|---|---|---|---|---|
| Profit share | 28.5 | 28.5 | 27.9 | 28.3 | |
| Investment ratio | 19.5 | 19.3 | 19.2 | 19.4 | |
| Savings ratio | 13.2 | 13.0 | 11.8 | 12.8 | |
| Self-financing ratio | 67.5 | 67.3 | 61.3 | 65.9 |
Total GFCF stepped back again
Total GFCF was still depressed (–0.9% after –0.8%). Due to less housing starts in the past quarters, construction investment decreased at the same rate than in Q4 2012 (–1.0%). Expenditure in manufactured goods was also poorly oriented (–1.3% after –1.8%). Non-financial corporations investment diminished again (–0.8% after –0.7%), and so did general government investment (–0.7% after –0.9%). Finally, the decline of household GFCF sped up (–1.3% after –0.8%).
Exports were still depressed
In Q1 2013, exports decreased again (–0.5% after –0.7%). Sales in energy, water and waste products (–15.8% after +0.5%) and manufactured goods (–0.4% after –1.5%) both contributed to this decline. Meanwhile, imports reached stability (+0.1% after –1.3%), notably imports of manufactured goods. Overall, foreign trade weighed down GDP evolution: –0.2 point after +0.2 point.
Changes in inventories slightly contributed to GDP
Changes in inventories contributed positively, yet weakly, to GDP evolution: +0.1 point after –0.3 point in Q4 2012. Quarterly profile was mostly impacted by changes in refined petroleum stocks.
Revisions
Revisions are larger this quarter than on previous publications, but their extent are typical of a first quarter. They come from new benchmarking due to revised annual accounts impacting 2010 (GDP growth unchanged at +1.6%), 2011 (+0.3 point at +2.0%) and 2012 (unchanged at 0.0%) and due to updates of seasonal and working day adjustments. Moreover, main indicators (industrial production index, producer and import price index and turnover index) were switched from base 2005 to base 2010. All these changes introduce revisions on quarterly data: Q1 2011 was the most noticeable one (+0.3 point at +1.1%). Q3 2012 was revised down (–0.1 point at +0.1%) while Q4 2012 was revised up (+0.1 point at –0.2%).
Pour en savoir plus
Time series : Operations on goods and services
Time series : Gross domestic product balance
Time series : Institutional sector accounts
Time series : Branch accounts
