


 23 November 2012
2012- n° 287In November 2012, the business climate remains deteriorated in services Monthly survey of services - November 2012
23 November 2012
2012- n° 287In November 2012, the business climate remains deteriorated in services Monthly survey of services - November 2012
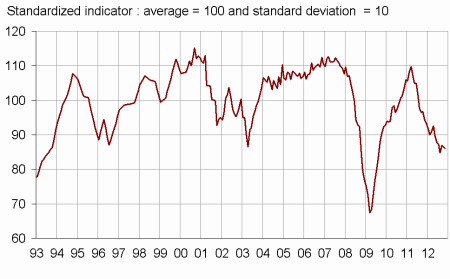
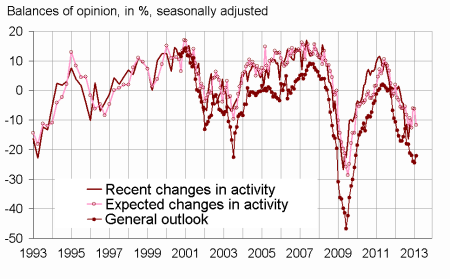
According to the business leaders surveyed in November 2012, the business climate in services remains stable. The synthetic indicator remains stable at 87 points, well below its long-term average. A little less business leaders than in October consider that their activity has slown down during the last few months. However, they revise downwards their expectations of activity for the months to come. The general outlook remains below its long-term average. The turning point indicator tends to indicate a more favorable economic situation’s dynamic, however it has to be confirmed in the next months.
According to the business leaders surveyed in November 2012, the business climate in services remains stable. The synthetic indicator remains stable at 87 points, well below its long-term average. A little less business leaders than in October consider that their activity has slown down during the last few months. However, they revise downwards their expectations of activity for the months to come. The general outlook remains below its long-term average. The turning point indicator tends to indicate a more favorable economic situation’s dynamic, however it has to be confirmed in the next months.
graphiqueGraph1 – Business climate synthetic indicator
graphiquegraph_retourn – Turning point indicator
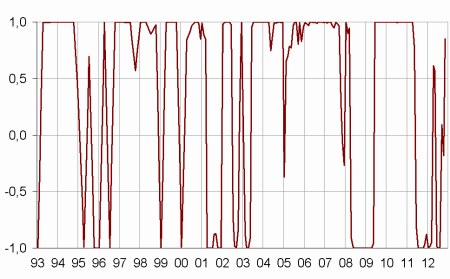
- Note: close to 1 (respectively -1), this indicator indicates a favourable short-term economic situation (respectively unfavourable).
graphiqueGraph2 – Activity
tableauTable_quarter – Economic outlook in the services sector
| Average* | Aug. 12 | Sept. 12 | Oct. 12 | Nov. 12 | |
|---|---|---|---|---|---|
| Business climate synthetic indicator | 100 | 85 | 87 | 86 | 86 |
| General outlook | –6 | –22 | –24 | –24 | –22 |
| Past activity | 3 | –11 | –16 | –12 | –10 |
| Expected activity | 3 | –13 | –6 | –6 | –12 |
| Expected demand | 1 | –15 | –13 | –12 | –13 |
| Business situation | –1 | –16 | –20 | –16 | –15 |
| Past selling prices | –3 | –8 | –10 | –9 | –10 |
| Expected selling prices | –1 | –8 | –7 | –11 | –9 |
| Past employment | 3 | –2 | –7 | –13 | –7 |
| except temporary work agencies | 1 | –4 | –7 | –9 | –4 |
| Expected employment | 3 | –8 | –5 | –6 | –8 |
| except temporary work agencies | 0 | –6 | –6 | –6 | –8 |
| Investments | |||||
| Past investments | 2 | –8 | –8 | –5 | –6 |
| Expected investments | 1 | –9 | –4 | –4 | –1 |
- * Average of the balances of opinion since 1988
- Source: Insee
Documentation
Methodology (2016) (pdf,158 Ko)
Pour en savoir plus
Time series : Economic outlook surveys – Services
