


 27 April 2012
2012- n° 111Despite March sharp decrease (-2.9%), households’ consumption in goods slightly increased
over the first quarter (+0.2%) Household consumption expenditure on goods - March 2012
27 April 2012
2012- n° 111Despite March sharp decrease (-2.9%), households’ consumption in goods slightly increased
over the first quarter (+0.2%) Household consumption expenditure on goods - March 2012
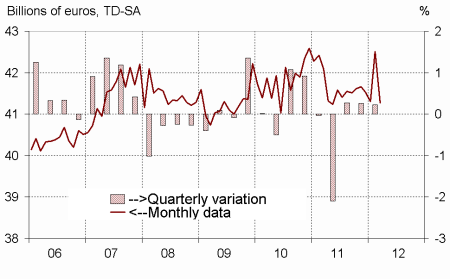
In March, households’ expenditure in goods decreased by 2.9% in volume*, after having increased by 2.9% in February. Over the first quarter, they increased by 0.2% (after +0.3% in Q4 2011). The decrease of expenditure in March was mainly explained by the decline of expenditure in energy products and, to a lesser extent, by that in food products.
In March, households’ expenditure in goods decreased by 2.9% in volume*, after having increased by 2.9% in February. Over the first quarter, they increased by 0.2% (after +0.3% in Q4 2011). The decrease of expenditure in March was mainly explained by the decline of expenditure in energy products and, to a lesser extent, by that in food products.
[* Volumes are chained and all figures are trading days and seasonally adjusted.]
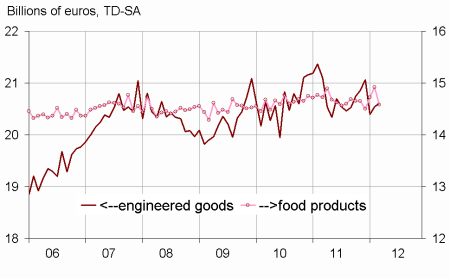
Engineered goods : slightly increasing in March (+0.3%)
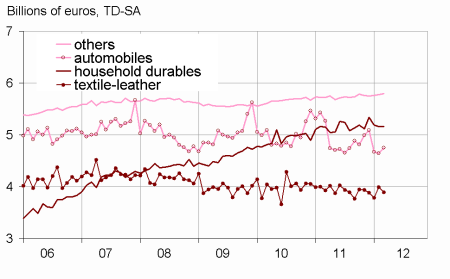
Durables: increasing in March
Households’ expenditure in durables increased in March (+1.5%, after –0.9% in February). Over the quarter, they decreased by 3.3%, after +2.7% in Q4 2011. Despite March recovery (+2.3% after -0.5% in February), expenditure in car purchases decreased over the first quarter (-5.6%, after +4.4%). Purchases in household durables slightly increased in March too (+0.2% after -0.6% in February) but declined over the quarter (–0.9% after +0.3%).
Textile-leather: decreasing
Consumption of textile and leather decreased in March (-2.5%) after a dynamic February. It decreased by 0.8% over the first quarter (after +1.5%).
Other engineered goods: slight increase
Consumption expenditure in other engineered goods slightly increased in March (+0.2% after +0.3% in February), and over the first quarter (+0.2%, after +0.6% in Q4 2011).
graphiquegraph1_new_ang – Total consumption of goods
graphiquegraph2_new_ang – Food and engineered goods
graphiquegraph3_new_ang – Decomposition of engineered goods
Food products: decreasing in March after two months of increase
In March, consumption of food products decreased (–2.3%, after two consecutive months of increase). It rose by 1.0% over the first quarter, after -0.1% in Q4 2011.
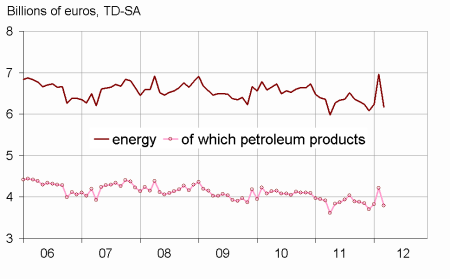
Energy: return to “normal” after the cold spell
After a sharp increase in Fevruary due to heating purchases during the cold spell, households’ consumption in energy products fell in March (-11.3%). Over the first quarter, it increased by 4.0% (after -3.2% in Q4 2011).
The evolution of household consumption in goods in February is scaled up by 0.1 point.
The increase of household consumption in goods is now estimated at -2.9% in February, instead of –3.0% estimated the previous month.
This revision is notably due to the integration of new information, in particular concerning computer and electronic products, as well as the revision of seasonality.
tableauenglish_trim – Households consumption expenditures in manufactured goods
| Janv. | Févr. | Mars | Mars 12/ | Q1 12/ | |
|---|---|---|---|---|---|
| 2012 | 2012 | 2012 | Mars 11 | Q4 11 | |
| Food products | 14.726 | 14.923 | 14.578 | ||
| Change (%) | 1.5 | 1.3 | –2.3 | –1.0 | 1.0 |
| Engineered goods | 20.392 | 20.542 | 20.607 | ||
| change (%) | –3.2 | 0.7 | 0.3 | –2.3 | –1.8 |
| Of which: | |||||
| Automobiles | 4.667 | 4.643 | 4.747 | ||
| Change (%) | –8.3 | –0.5 | 2.3 | –9.9 | –5.6 |
| Household durables | 5.185 | 5.157 | 5.165 | ||
| Change (%) | –2.9 | –0.6 | 0.2 | 0.3 | –0.9 |
| Textile-leather | 3.784 | 3.994 | 3.894 | ||
| Change (%) | –2.5 | 5.6 | –2.5 | –1.0 | –0.8 |
| Other en- gineered goods | 5.760 | 5.780 | 5.793 | ||
| Change (%) | 0.2 | 0.3 | 0.2 | 1.3 | 0.2 |
| Energy | 6.2 | 7.0 | 6.2 | ||
| Change (%) | 2.5 | 11.6 | –11.3 | –3.0 | 4.0 |
| Including petro- leum products | 3.8 | 4.2 | 3.8 | ||
| Change (%) | 3.4 | 10.1 | –10.0 | –3.1 | 3.6 |
| Total | 41.299 | 42.504 | 41.265 | ||
| Change (%) | –0.5 | 2.9 | –2.9 | –2.0 | 0.2 |
| Manufactured goods | 35.858 | 36.386 | 35.998 | ||
| Change (%) | –1.0 | 1.5 | –1.1 | –1.9 | –0.5 |
graphiquegraph4_new_ang – Energy
Documentation
Methodology (pdf,23 Ko)
Pour en savoir plus
