


 30 April 2013
2013- n° 104Households consumption of goods increased in March (+1.3%), but decreased over the
first quarter (-0.4%) Household consumption expenditure on goods - March 2013
30 April 2013
2013- n° 104Households consumption of goods increased in March (+1.3%), but decreased over the
first quarter (-0.4%) Household consumption expenditure on goods - March 2013
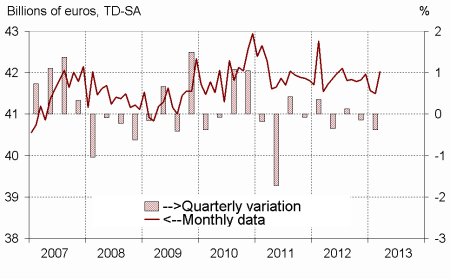
In March, households expenditure on goods increased by 1.3% in volume*, after a 0.2% decrease in February. Over the first quarter, they decreased by 0.4% (after –0.1% in Q4 2012). The increase in March iwas mainly attributable to a bounce in food products and to the dynamism of the consumption of energy products.
In March, households expenditure on goods increased by 1.3% in volume*, after a 0.2% decrease in February. Over the first quarter, they decreased by 0.4% (after –0.1% in Q4 2012). The increase in March iwas mainly attributable to a bounce in food products and to the dynamism of the consumption of energy products.
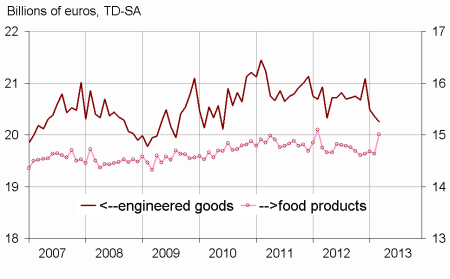
Engineered goods : decreasing
Durables: slightly decreasing
After a slight bounce in February (+1.0%), households expenditure on durable goods were almost stable in March (–0.1%). Over the first quarter, they decreased by 3.9% (after +0.9% in Q4 2012). Expenditure on cars decreased in March (–0.9%, after +2.7% in February), and, given the fall in January (–11,0%), sharply decreased over the quarter (–6.8% after –0.1%). Moreover, despite a recovery in March (+1.2%, after –1.0% in February), purchases in household durables weakened over the quarter (–0.7%, after +2.4% in Q4 2012).
Textile-leather: decreasing again
After a sharp decresase in February (-4.8%), households consumption of textile and leather declined again in March (–2.9%). The low temperatures could have been unfavorable to purchases in spring and summer clothes. Consumption of textile-leather decreased by 1.7% over the first quarter (after –0.7%).
[* Volumes are chained and all figures are trading days and seasonally adjusted.]
graphiquegraph1_new_ang – Total consumption of goods
graphiquegraph2_new_ang – Food and engineered goods
graphiquegraph3_new_ang – Decomposition of engineered goods
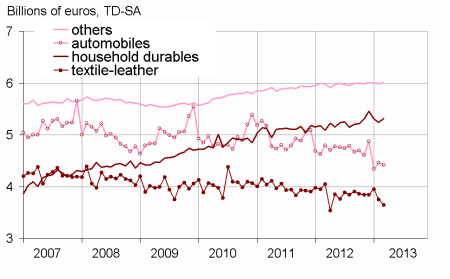
Other engineered goods: slightly increasing
Consumption expenditure on other engineered goods slightly increased in March (+0.3%, after –0.3% in February). In particular, purchases on hardware slightly improved. It was stable over the quarter (after –0.7%).
Food products: rebound in March
After a decrease in February (–0.3%), consumption of food products was dynamic in March (+2.6%). It increased over the first quarter too (+0.9%, after –0.9% over Q4 2012).
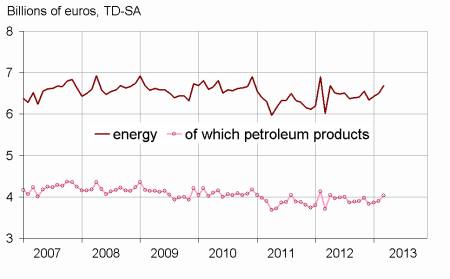
Energy: increasing
After two consecutive months of increase in January (+1.4%) and February (+1.2%), households consumption of energy products accelerated in March (+2.6%), due to below average temperatures. Consumption of energy accelerated this winter (+1.7%), after a stability in autumn.
The evolution of household consumption of goods in February is not revised
The increase in consumption of goods in February is still estimated at –0.2%, as it was for the previous publication. Some minor revisions offset each other.
tableauenglish_trim – Households consumption expenditures on goods
| Jan. | Feb. | March | March 13/ | Q1 13/ | |
|---|---|---|---|---|---|
| 2013 | 2013 | 2013 | March 12 | Q4 12 | |
| Food products | 14.674 | 14.629 | 15.011 | ||
| Change (%) | 0.3 | –0.3 | 2.6 | 1.8 | 0.9 |
| Engineered goods | 20.485 | 20.361 | 20.250 | ||
| change (%) | –2.9 | –0.6 | –0.5 | –3.2 | –2.3 |
| Of which: | |||||
| Automobiles | 4.341 | 4.458 | 4.417 | ||
| Change (%) | –11.0 | 2.7 | –0.9 | –7.9 | –6.8 |
| Household durables | 5.301 | 5.246 | 5.310 | ||
| Change (%) | –2.9 | –1.0 | 1.2 | 4.4 | –0.7 |
| Textile-leather | 3.947 | 3.757 | 3.648 | ||
| Change (%) | 2.8 | –4.8 | –2.9 | –9.9 | –1.7 |
| Other engineered goods | 6.005 | 5.987 | 6.002 | ||
| Change (%) | 0.0 | –0.3 | 0.3 | 0.4 | 0.0 |
| Energy | 6.426 | 6.501 | 6.685 | ||
| Change (%) | 1.4 | 1.2 | 2.8 | 11.2 | 1.7 |
| Including petroleum products | 3.867 | 3.894 | 4.029 | ||
| Change (%) | 1.1 | 0.7 | 3.4 | 8.6 | 0.8 |
| Total | 41.568 | 41.503 | 42.027 | ||
| Change (%) | –0.9 | –0.2 | 1.3 | 1.2 | –0.4 |
| Manufactured goods | 35.851 | 35.670 | 36.096 | ||
| Change (%) | –1.5 | –0.5 | 1.2 | –0.6 | –1.0 |
graphiquegraph4_new_ang – Energy
Documentation
Methodology (pdf,23 Ko)
Pour en savoir plus
