


 30 March 2012
2012- n° 81In February, the cold spell drove households’ consumption in goods up (+3.0%) Household consumption expenditure on goods - February 2012
30 March 2012
2012- n° 81In February, the cold spell drove households’ consumption in goods up (+3.0%) Household consumption expenditure on goods - February 2012
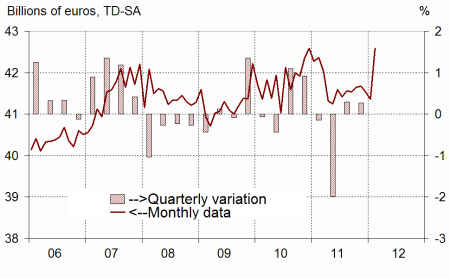
In February, households’ expenditure in goods increased by 3.0% in volume*, after having decreased by 0.4% in January. Two-thirds of this bouncing are attributable to the sharp increase of expenditure in energy products. Purchases in food products and clothing are dynamic too.
In February, households’ expenditure in goods increased by 3.0% in volume*, after having decreased by 0.4% in January. Two-thirds of this bouncing are attributable to the sharp increase of expenditure in energy products. Purchases in food products and clothing are dynamic too.
[* Volumes are chained and all figures are trading days and seasonally adjusted.]
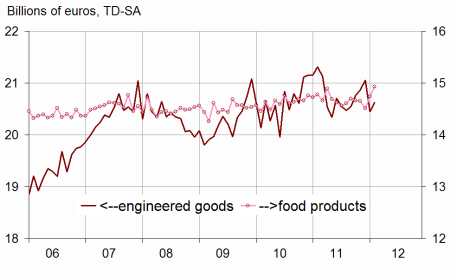
Engineered goods : bouncing
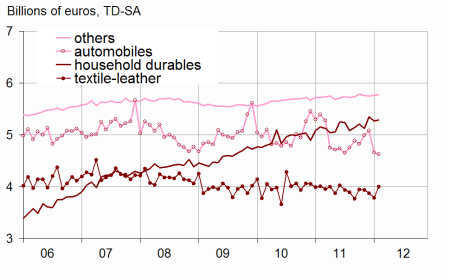
Durables: slightly decreasing
Households’ expenditure in durables decreased in February (-0.7%, after –4.7% in January), notably because of a new decrease in car purchases (–0.8% in February after –8.3%) imputable to the second-hand market. Furthermore, purchases in household durables slightly increased (+0.3% after -1.4%).
Textile-leather: sharply bouncing
Consumption of textile and leather bounced in February (+5.7%) after two consecutive months of decreases (–2.5% in January and –1.5% in December). The cold spell could have driven purchases in winter clothing up.
Other engineered goods: slight increase
Consumption expenditure in other engineered goods slightly accelerated in February (+0.4% after +0.2%), notably those in hardware.
graphiquegraph1_new_ang – Total consumption of goods
graphiquegraph2_new_ang – Food and engineered goods
graphiquegraph3_new_ang – Decomposition of engineered goods
Food products: increasing
In February, consumption in food products increased again (+1.3% after +1.6%).
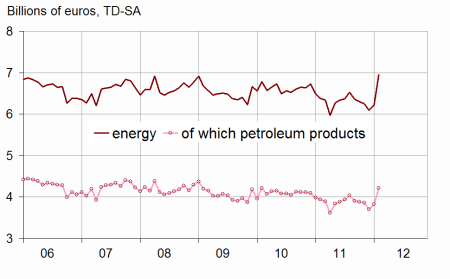
Energy: expenditure sharply increasing
Households’ consumption in energy products markedly accelerated in February (+11.7% after +2.3%). Indeed, very low temperatures during the first two weeks drove heating purchases up (electricity, gas, fuel).
The evolution of household consumption in goods in January is not revised.
The decrease of household consumption in goods in January is still estimated at –0.4%.
tableautab1_eng – Households consumption expenditures in goods
| Déc. | Janv. | Févr. | Févr.12/ | |
|---|---|---|---|---|
| 2011 | 2011 | 2011 | Févr.11 | |
| Food products | 14.512 | 14.743 | 14.930 | |
| Change (%) | –1.0 | 1.6 | 1.3 | 1.0 |
| Engineered goods | 21.055 | 20.448 | 20.626 | |
| change (%) | 0.9 | –2.9 | 0.9 | –3.2 |
| Of which: | ||||
| Automobiles | 5.082 | 4.660 | 4.623 | |
| Change (%) | 1.8 | –8.3 | –0.8 | –14.3 |
| Household durables | 5.348 | 5.272 | 5.290 | |
| Change (%) | 4.3 | –1.4 | 0.3 | 2.6 |
| Textile-leather | 3.879 | 3.782 | 3.998 | |
| Change (%) | –1.5 | –2.5 | 5.7 | –0.2 |
| Other engineered goods | 5.748 | 5.758 | 5.779 | |
| Change (%) | –0.2 | 0.2 | 0.4 | 1.0 |
| Energy | 6.086 | 6.228 | 6.954 | |
| Change (%) | –2.6 | 2.3 | 11.7 | 9.0 |
| Including petroleum products | 3.708 | 3.823 | 4.215 | |
| Change (%) | –3.9 | 3.1 | 10.2 | 7.0 |
| Total | 41.527 | 41.358 | 42.585 | |
| Change (%) | –0.4 | –0.4 | 3.0 | 0.5 |
| Manufactured goods | 36.222 | 35.917 | 36,468 | |
| Change (%) | –0.3 | –0.8 | 1.5 | –1.3 |
graphiquegraph4_new_ang – Energy
Documentation
Methodology (pdf,23 Ko)
Pour en savoir plus
