


 12 December 2012
2012- n° 302The Consumer Prices Index decreased by 0.2% in November 2012; it rose by 1.4% year-on-year Consumer price index - final results - november 2012
12 December 2012
2012- n° 302The Consumer Prices Index decreased by 0.2% in November 2012; it rose by 1.4% year-on-year Consumer price index - final results - november 2012
In November 2012, the Consumer Price index (CPI) decreased by 0.2%, after a rise by 0.2% in October. Over a year, the CPI rose by 1.4% (+1.9% in October). Seasonally adjusted, the CPI went down by 0.1% in November (compared to an increase by 0.2% in October) and grew by +1.4% compared to November 2011. The largest downward pressures on the change in the CPI of November resulted mainly from a new decrease in energy prices (especially a new drop in petroleum product prices.) It reflected also the continuation of the marked decrease in telecom prices and a drop in aerial transport fares. There were minor downward and upward pressures from other prices in November. Excluding tobacco, the CPI went down by 0.2% in November (+1.3% compared to November 2011). In November 2012, prices of tobacco were stable but remained very dynamic year-on-year (+6.9%, the same rate than in November 2011).
Monthly change: -0.2% ; Year-on-year: +1.4%
In November 2012, the Consumer Price index (CPI) decreased by 0.2%, after a rise by 0.2% in October. Over a year, the CPI rose by 1.4% (+1.9% in October). Seasonally adjusted, the CPI went down by 0.1% in November (compared to an increase by 0.2% in October) and grew by +1.4% compared to November 2011. The largest downward pressures on the change in the CPI of November resulted mainly from a new decrease in energy prices (especially a new drop in petroleum product prices.) It reflected also the continuation of the marked decrease in telecom prices and a drop in aerial transport fares. There were minor downward and upward pressures from other prices in November. Excluding tobacco, the CPI went down by 0.2% in November (+1.3% compared to November 2011). In November 2012, prices of tobacco were stable but remained very dynamic year-on-year (+6.9%, the same rate than in November 2011).
Energy prices declined again in November
Energy prices declined by 1.2% in November, they rose by 2.7% year-on-year. This decline in November came mainly from a new drop in petroleum product prices (–2.0%; +1.2% year-on-year), especially from fuels for transport prices (–2.3% in November after –1.4% in October). Those prices slowed down, growing by 0.3% year-on-year in November. Heat fuel prices decreased also in November by 1.4% (after –1.0% in October) but increased significantly year-on-year (+4.6%). Gas and electricity prices were stable in November. They grew respectively by 8.3% and 3.2% year-on-year in November.
tableauOLE_LINK2 – Detailed fiigures for various groups
| Percentage change | ||||
|---|---|---|---|---|
| Items | weight 2012 | Index Nov. 2012 | Month rate | Annual rate |
| a) All households - France | ||||
| All items (00 E) | 10000 | 126,35 | –0,2 | 1,4 |
| All items SA (00 C) | 10000 | 126,60 | –0,1 | 1,4 |
| Food (4000 E) | 1638 | 131,76 | 0,0 | 2,6 |
| Fresh food (4001 E) | 205 | 140,29 | –1,1 | 8,7 |
| Food excluding fresh products (4002 E) | 1433 | 130,54 | 0,2 | 1,7 |
| Tobacco (4034 E) | 198 | 241,37 | 0,0 | 6,9 |
| MANUFACTURED PRODUCTS (4003 E) | 2987 | 102,03 | 0,2 | 0,5 |
| Clothing and footwear (4004 E) | 466 | 110,68 | 0,0 | 1,2 |
| Medical products (4005 E) | 460 | 82,85 | –0,2 | –2,9 |
| Other manufactured products (4006 E) | 2061 | 104,61 | 0,3 | 1,0 |
| ÉNERGY (4007 E) | 868 | 176,89 | –1,2 | 2,7 |
| Petroleum products (4008 E) | 518 | 208,42 | –2,0 | 1,2 |
| SERVICES (4009 E) | 4309 | 131,67 | –0,2 | 1,1 |
| Actual rentals and services for dwellings (4010 E) | 737 | 138,69 | 0,2 | 2,1 |
| Medical services (4011 E) | 529 | 121,60 | 0,0 | 1,2 |
| Transport and communication services (4012 E) | 523 | 94,73 | –2,4 | –7,5 |
| Other services (4013 E) | 2520 | 140,55 | 0,0 | 2,6 |
| ALL ITEMS EXCLUDING RENTALS AND TOBACCO (5000 E) | 9217 | 124,05 | –0,2 | 1,3 |
| ALL ITEMS EXCLUDING TOBACCO (4018 E) | 9802 | 124,61 | –0,2 | 1,3 |
| b) manual or clerical worker headed urban households- France | ||||
| ALL ITEMS EXCLUDING TOBACCO (4018 D) | 9716 | 124,40 | –0,2 | 1,3 |
| ALL ITEMS (00 D) | 10000 | 126,95 | –0,2 | 1,4 |
- Source : Insee - Consumer Price Indexes
tableauTableau1 – Detailed figures for Core inflation* and HICP**
| Percentage change | ||||
|---|---|---|---|---|
| Items | weight 2012 | Index Nov. 2012 | Month rate | Annual rate |
| All items "Core inflation" (4022 S) | 6096 | 121,55 | 0,0 | 0,7 |
| Food excuding fresh products, meat, milk and exotic products (4019 S) | 701 | 126,32 | 0,1 | 1,0 |
| Manufactured products (4020 S) | 2472 | 105,70 | 0,1 | 0,9 |
| Services including actual rentals and services for dwellings (4021 S) | 2923 | 136,09 | –0,1 | 0,3 |
| All items HICP (00 H) | 113,99 | –0,2 | 1,6 | |
- * ISJ : Core inflation indicator excludes public sector prices, the most volatile consumer prices and the tax measures. This index is seaonally adjusted. This index is calculated for all hourseholds in France excluding overseas departments and territories (base 100 1998).
- **HICP : Harmonised Indices of Consumer Prices are inflation figures required under the Treaty on the functionning of the Europena Union. They are designed for international comparison of consumer price inflation between Menber states of the Union. This index is calculated for all households in France (base 100 2005).
- Source : Insee - Consumer Price Indexes
graphiqueGraphique1English – Consumer price index (IPC) and Core inflation (ISJ) – year-on-year changes
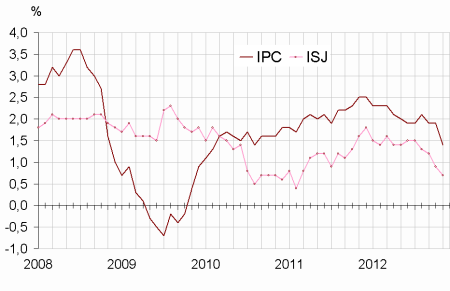
- Source : Insee - indice des prix à la consommation
Significant drop in service prices
In November 2012, service prices fell by 0.2%. They rose by 0.2% in November 2011. Over a year, they increased by 1.1%. The most significant downward contribution to the change in the service CPI in November was due to a new large decline in communication prices (-3.3% in November; -15.1% year-on-year), due to more favorable new mobile rates. Besides, air fares declined sharply in November (–5.6% over a month), above all for long haul flights. Package travel prices decreased seasonally in November (–2.9%; +3.6% year-on-year), as well as hotel and restaurant prices (-0.2% in November; +3.0% year-on-year).
Food prices stabilized in November
Food prices were steady in November 2012. After a sbstantial rise in October (+4.9%), prices of fresh food products decreased by 1.1% in November. Excluding these products, food prices increased by 0.2% in November. Most of the upward pressure came from meat prices (+0.6% over a month in November after +0.7% in October). Year-on-year, food prices grew by 2.6% in November 2012, those of fresh foodstuffs by 8.7% and those of other food products by 1.7%
Rise in manufactured product prices in November
Overall, prices of manufactured products went up by 0.2% in November 2012 (+0.5% year-on-year). Clothing and footwear prices stabilized in November (+1.2% over a year). Changes in prices of the other manufactured products were more mixed : Most of the upward pressure came from a seasonal rise in flower and plant prices (+16.4%; +7.7% year-on-year) and in jewellery, clocks and watches (+1.2% in November, like in November 2011; +5.7% year-on year) and in a lesser manner in perfumery and beauty products (+0.4% in November; +1.6% year-on-year). On the opposite, downward pressure came from seasonally decrease in game and toys prices (–3.8% in November 2012; –2.9% in November 2011; –1.1% year-on-year). Finally, price drop of audio-visual, photographic and information processing equipment continued (–0.7% in November; –6.6% year-on-year).
Core inflation stable in November
Core inflation indicator (ISJ) steady in November 2012, slipped year-on-year (+0.7% in November after +0.9% in October). In November, the harmonized Index of Consumer Prices (HICP) declined by 0.2% over a month but increased by 1.6% year-on-year (+2.1% in October).
Pour en savoir plus
