


 31 July 2012
2012- n° 192Despite June slight increase (+0.1%), households’ consumption on goods slightly decreased
over the second quarter (–0.2%) Household consumption expenditure on goods - June 2012
31 July 2012
2012- n° 192Despite June slight increase (+0.1%), households’ consumption on goods slightly decreased
over the second quarter (–0.2%) Household consumption expenditure on goods - June 2012
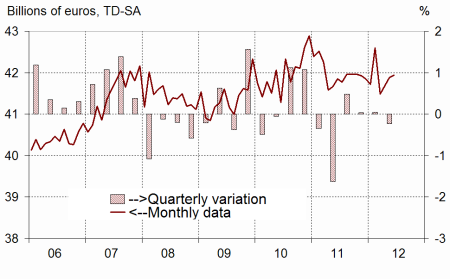
In June, households’ expenditure on goods increased by 0.1% in volume*, after having increased by 0.5% in May. Over the second quarter, they decreased by 0.2% (after a stability in Q1 2012). The slight increase of expenditure in June was attributable to food products consumption, whose increase offset the decline of expenditure on energy products.
In June, households’ expenditure on goods increased by 0.1% in volume*, after having increased by 0.5% in May. Over the second quarter, they decreased by 0.2% (after a stability in Q1 2012). The slight increase of expenditure in June was attributable to food products consumption, whose increase offset the decline of expenditure on energy products.
[* Volumes are chained and all figures are trading days and seasonally adjusted.]
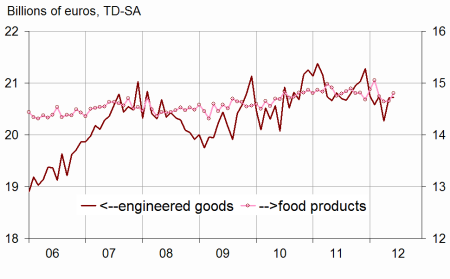
Engineered goods : stability in June
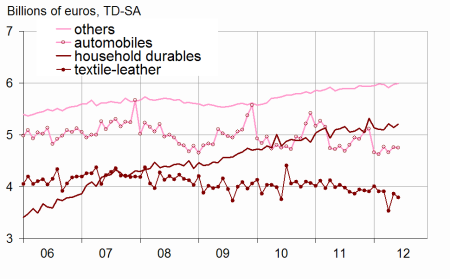
Durables: increasing in June
Households’ expenditure on durables increased in June (+0.6% after +0.3% in May), notably driven up by household durables. Over the quarter, they increased by 1.1%, after a 4.1% decrease in Q1 2012. Despite a slight decrease in June (–0.2% after +2.2% in May), attributable to the second-hand market, car purchases bounced over the first quarter (+0.9% after –7.0%).
Textile-leather: decreasing
Consumption of textile and leather declined in June (–1.7%) after an increase in May (+9.3%). This decrease could be attributable to the late beginning of the summer sales. It decreased more sharply over the second quarter (–5.3% after +0.3%).
Other engineered goods: almost stable
Consumption expenditure on other engineered goods slightly increased in June (+0.2%, after +1.1% in May), and slightly decreased over the second quarter (–0.2%, after +0.5% in Q1 2012).
graphiquegraph1_new_ang – Total consumption of goods
graphiquegraph2_new_ang – Food and engineered goods
graphiquegraph3_new_ang – Decomposition of engineered goods
Food products: increasing in June
In June, consumption of food products increased (+1.0%, after +0.1% in May). It decreased by 1.3% over the second quarter, after +0.8% in Q1 2012.
Energy: decreasing in June
Households’ consumption of energy products decreased again in June (-1.3% after -2.9% in May). It increased over the second quarter (+2.7% after +3.5% in Q1 2012) because of large heating expenditure in April.
The evolution of household consumption on goods in may is scaled up by 0.1 point.
The change of household consumption on goods is now estimated at +0.5% in May, instead of +0.4% estimated the previous month.
This revision is notably due to the integration of new information and to the revision of seasonality.
tableauenglish_trim – Households consumption expenditures on goods
| Avril | Mai | Juin | Juin 12/ | Q2 12/ | |
|---|---|---|---|---|---|
| 2012 | 2012 | 2012 | Juin 11 | Q1 12 | |
| Food products | 14.639 | 14.655 | 14.802 | ||
| Change (%) | –0.7 | 0.1 | 1.0 | 0.3 | –1.3 |
| Engineered goods | 20.266 | 20.716 | 20.720 | ||
| change (%) | –2.3 | 2.2 | 0.0 | –0.4 | –0.6 |
| Of which: | |||||
| Automobiles | 4.663 | 4.763 | 4.753 | ||
| Change (%) | –2.3 | 2.2 | –0.2 | –0.6 | 0.9 |
| Household durables | 5.217 | 5.144 | 5.209 | ||
| Change (%) | 2.4 | –1.4 | 1.3 | 1.8 | 1.5 |
| Textile-leather | 3.536 | 3.866 | 3.798 | ||
| Change (%) | –9.6 | 9.3 | –1.7 | –5.9 | –5.3 |
| Other engineered goods | 5.909 | 5.973 | 5.988 | ||
| Change (%) | –1.1 | 1.1 | 0.2 | 1.7 | –0.2 |
| Energy | 6.7 | 6.5 | 6.4 | ||
| Change (%) | 10.1 | –2.9 | –1.3 | 1.4 | 2.7 |
| Including petroleum products | 4.1 | 4.0 | 4.0 | ||
| Change (%) | 8.3 | –2.7 | 0.8 | 3.3 | 3.3 |
| Total | 41.687 | 41.883 | 41.938 | ||
| Change (%) | 0.5 | 0.5 | 0.1 | 0.2 | –0.2 |
| Manufactured goods | 35.687 | 36.207 | 36.400 | ||
| Change (%) | –1.4 | 1.5 | 0.5 | 0.3 | –0.5 |
graphiquegraph4_new_ang – Energy

Documentation
Methodology (pdf,23 Ko)
Pour en savoir plus
