


 29 June 2012
2012- n° 162In May, households’ consumption in goods increased again (+0.4%) Household consumption expenditure on goods - May 2012
29 June 2012
2012- n° 162In May, households’ consumption in goods increased again (+0.4%) Household consumption expenditure on goods - May 2012
In May, households’ expenditure on goods increased by 0.4% in volume*, after having increased by 0.7% in April. This increase is mainly attributable to the bouncing of clothing purchases. On the other hand, expenditure on energy decreased after a dynamic April.
In May, households’ expenditure on goods increased by 0.4% in volume*, after having increased by 0.7% in April. This increase is mainly attributable to the bouncing of clothing purchases. On the other hand, expenditure on energy decreased after a dynamic April.
Engineered goods : increasing
Durables: slightly rising
Households’ expenditure on durables increased in May (+0.4%, after -0.1% in April), notably because of an increase in car purchases (+1.9% in May after –1.8%) on the new market as well as on the second-hand one. Conversely, purchases of household durables decreased (–1.4% after +2.1%).
Textile-leather: sharply bouncing
After a sharp decrease in April, probably due to a weather unfavourable to purchases of spring-summer clothing, purchases of textile-leather sharply bounced in May (+11.1% after –9.9% in April).
Other engineered goods: slightly increasing
Consumption expenditure on other engineered goods slightly increased in May (+1.1% after –1.0% in April), notably driven up by the bouncing of hardware purchases.
[* Volumes are chained and all figures are trading days and seasonally adjusted.]
graphiquegraph1_new_ang – Total consumption of goods

graphiquegraph2_new_ang – Food and engineered goods

graphiquegraph3_new_ang – Decomposition of engineered goods

Food products: slightly decreasing
After two consecutive months of decline, consumption in food products decreased again in May (-0.3%), despite of a bouncing of expenditure on tobacco.
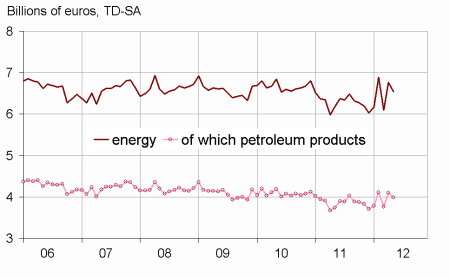
Energy: decreasing
After a sharp increase in April (+11.1%) due to colder-than-normal temperatures, households’ consumption in energy products decreased in May (–3.3%). Notably, expenditure on gas and electricity sharply decreased, while consumption in carburant slightly bounced.
The increase of consumption in goods is scaled up by 0.1 point
The increase of household consumption in goods is now estimated at +0.7%, instead of a +0.6% estimated the previous month. This revision is notably due to the integration of new information, as well as the revision of seasonality.
graphiquegraph4_new_ang – Energy
tableautab1_eng – Households consumption expenditure on goods
| Mars | Avril | Mai | Mai 12/ | |
|---|---|---|---|---|
| 2012 | 2012 | 2012 | Mai 11 | |
| Food products | 14.743 | 14.654 | 14.608 | |
| Change (%) | –2.1 | –0.6 | –0.3 | –1.8 |
| Engineered goods | 20.745 | 20.268 | 20.790 | |
| change (%) | 0.8 | –2.3 | 2.6 | 0.6 |
| Of which: | ||||
| Automobiles | 4.782 | 4.696 | 4.784 | |
| Change (%) | 3.2 | –1.8 | 1.9 | 1.2 |
| Household durables | 5.084 | 5.191 | 5.119 | |
| Change (%) | –0.3 | 2.1 | –1.4 | 0.5 |
| Textile-leather | 3.903 | 3.518 | 3.909 | |
| Change (%) | –0.3 | –9.9 | 11.1 | –2.1 |
| Other engineered goods | 5.976 | 5.914 | 5.980 | |
| Change (%) | –0.1 | –1.0 | 1.1 | 2.3 |
| Energy | 6.095 | 6.772 | 6.546 | |
| Change (%) | –11.5 | 11.1 | –3.3 | 5.8 |
| Including petroleum products | 3.758 | 4.102 | 3.986 | |
| Change (%) | –8.5 | 9.1 | –2.8 | 6.5 |
| Total | 41.479 | 41.761 | 41.919 | |
| Change (%) | –2.6 | 0.7 | 0.4 | 0.6 |
| Manufactured goods | 36.186 | 35.699 | 36.207 | |
| Change (%) | –0.6 | –1.3 | 1.4 | 0.2 |
Documentation
Methodology (pdf,23 Ko)
Pour en savoir plus
