


 31 March 2014
2014- n° 75Overall producer prices of agricultural products slid in February Indices of agricultural prices - February 2014
31 March 2014
2014- n° 75Overall producer prices of agricultural products slid in February Indices of agricultural prices - February 2014
In February, overall producer prices of agricultural products dipped (-0.8 % compared to January); over one year they dropped by 5.5 %.
In February, overall producer prices of agricultural products dipped (-0.8 % compared to January); over one year they dropped by 5.5 %.
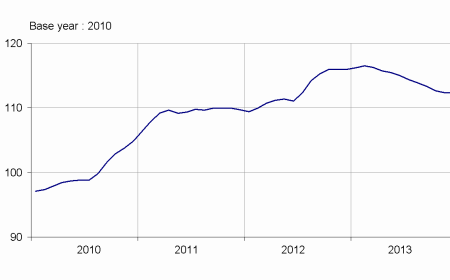
Cereals prices did not move much in February (–0.3 %). This quasi-stability resulted from different factors that offset each other. Indeed, bullish forecasts for the next crops of wheat and maïze were counterbalanced by immediate fears of intense cold in the United-States and in the Black Sea region.
graphiquecereal – Producer prices of cereals

- Source : INSEE
Oleaginous prices, mainly driven up by the price of rape - the main oleaginous seed grown in France - increased in February (+5.3 %). The supply of rape was limited. Canada hardly managed to convey its crop due to problems occuring in the transportation chain because of the cold, while the Australian availabilities have been running low. Furthermore, the increases in soy and palm oil prices, due to bad weather conditions in Brazil and Malaysia, drove rape prices up, whose uses are similar.
Overall prices of wines increased by 11.7 % over one year (and by 18.6 % for PDO wines): the bad weather conditions during both the flowering period and the harvest lessened the yields of the last production.
Potatoe prices significantly decreased compared to last year (-22.9 %). This was a return to normal as the last but one crop had been particularly low in North-Western Europe.
Fresh fruits prices decreased year-over-year (–18.7 %). Apple and pear prices tumbled as their production rose sharply in 2013. Conversely, kiwi prices leaped due to a moderate competition from Southern European countries (Greece and Italy).
graphiquevegetable – Producer prices of fresh vegetables
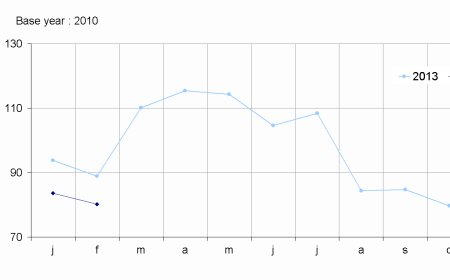
- Source : SSP (ministère de l'Agriculture)
Fresh vegetables prices went down year-over-year (–9.8 %). Chicory, cauliflower and leek prices plumeted, due to a bearish demand, from consumers and industry as well (for cauliflower). Additionally, the balmy weather sped up the harvests of leeks, unbalancing even more this market.
graphiquepig – Producer prices of pigs and large cattle
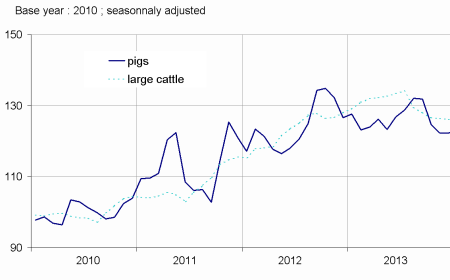
On a seasonally adjusted basis, animal prices decreased in February (-1.9 %). Pig prices tumbled due to a sanitary embargo from Russia stopping the exportations from the EU toward this country. The slaughters have been reduced during the last two years to balance a dull demand.
tableauTab1 – Indices of producer prices of agricultural products (IPPAP)
| Variation as % over | |||||
|---|---|---|---|---|---|
| weights | Feb. 2014 | a month | 3 months | a year | |
| raw | Seasonally adjusted | raw | |||
| Agricultural goods output | 1000 | 116.4 | –0.8 | –2.5 | –5.5 |
| excluding fruits and vegetables | 900 | 118.9 | –0.5 | –1.7 | –4.8 |
| Crop output (excluding fruits and vegetables) | 503 | 119.7 | 0.0 | –1.3 | –8.4 |
| Cereals | 188 | 114.7 | –0.3 | –4.0 | –20.1 |
| of which soft wheat | 112 | 116.1 | –0.5 | –5.0 | –20.1 |
| grain maize | 41 | 104.0 | +0.4 | –2.2 | –24.0 |
| Potatoes | 26 | 139.1 | /// | /// | –22.9 |
| Wines | 177 | 128.8 | +1.1 | +3.6 | +11.7 |
| Protected designation of origin | 84 | 137.5 | +1.6 | +5.9 | +18.6 |
| other wines | 23 | 131.6 | +1.5 | +3.5 | +6.2 |
| Oleaginous | 49 | 101.6 | +5.3 | +0.3 | –20.9 |
| Horticultural products | 30 | 111.7 | –1.4 | –0.9 | +0.1 |
| Other crop products | 33 | 117.6 | +0.5 | +2.2 | –2.8 |
| Fruits and vegetables (1) | 100 | 93.7 | /// | /// | –12.9 |
| Fresh vegetables | 53 | 80.2 | /// | /// | –9.8 |
| Fresh fruits | 35 | 107.5 | /// | /// | –18.7 |
| Animal output | 397 | 118.0 | –1.2 | –2.1 | +0.3 |
| Animals | 235 | 118.0 | –1.9 | –2.0 | –4.5 |
| of which large cattle | 96 | 124.4 | +0.1 | –0.2 | –3.4 |
| calves | 26 | 115.8 | +0.8 | +2.7 | +1.7 |
| pigs | 54 | 110.7 | –7.9 | –7.2 | –7.9 |
| sheep | 10 | 111.2 | –3.3 | –4.5 | +5.9 |
| poultry | 46 | 115.6 | –0.1 | –2.1 | –8.2 |
| of which chicken | 28 | 115.6 | –0.1 | –2.4 | –8.3 |
| Milk | 147 | 118.6 | 0.0 | –1.9 | +11.1 |
| of which cow milk (2) | 137 | 119.5 | 0.0 | –2.0 | +11.6 |
| Eggs | 15 | 112.2 | –1.5 | –7.6 | –15.1 |
- (1) Including vegetables for industry.
- (2)The price for February is not yet known and therefore is estimated by carrying forward the seasonally adjusted price from January
- Sources: INSEE - SSP (ministry of agriculture)
Purchase prices of the means of agricultural production rose in February.
Overall prices of intermediate consumptions and investment went up in February (+0.2 % in both cases). Over one year, animal feed and fertilisers prices roughly decreased by 10 %.
graphiquemeans – Purchase price of the means of agricultural production
tableauTab2 – Indices of purchase prices of the means of agricultural production (IPAMPA)
| weights | Feb. 2014 | Variation as % over | |||
|---|---|---|---|---|---|
| a month | 3 months | a year | |||
| Total input | 1000 | 112.9 | +0.2 | +0.5 | –3.1 |
| Intermediate consumptions | 764 | 114.8 | +0.2 | +0.4 | –4.3 |
| Energy (1) | 100 | 118.8 | –0.4 | –0.3 | –3.9 |
| Seeds | 57 | 109.5 | +0.1 | +0.8 | +1.8 |
| Fertilisers and soil improvers | 92 | 116.2 | +2.2 | +2.6 | –10.4 |
| Plant protection products | 78 | 100.2 | –0.2 | –1.2 | +0.8 |
| Animal feed | 205 | 125.8 | 0.0 | +0.1 | –9.2 |
| Veterinary expenses | 43 | 110.2 | –0.2 | +0.3 | +2.3 |
| Small equipment and tools | 17 | 108.7 | 0.0 | –1.1 | +0.8 |
| Maintenance of materials | 67 | 111.2 | +0.4 | +1.9 | +3.1 |
| Maintenance of buildings | 9 | 106.6 | –0.1 | –0.2 | –0.4 |
| Other goods and services | 97 | 101.5 | 0.0 | +0.3 | –0.2 |
| Goods and services contributing to investment | 236 | 106.9 | +0.2 | +0.5 | +1.2 |
| Material | 186 | 107.0 | +0.3 | +0.5 | +1.9 |
| Tractors | 79 | 107.7 | +0.2 | +0.5 | +1.9 |
| Machinery and plant for cultivation | 36 | 107.9 | +0.8 | +1.8 | +3.2 |
| Machinery and plant for harvesting | 42 | 107.2 | +0.2 | –0.1 | +1.8 |
| Utility vehicles | 18 | 103.3 | 0.0 | +0.1 | +0.7 |
| Total input | 50 | 106.4 | –0.1 | +0.2 | –1.7 |
- (1) The repayment of the domestic tax on energy products (TICPE) benefiting farmers has been applied in advance for the year 2014
- Sources: INSEE - SSP (ministry of agriculture)
Documentation
Methodology (pdf,122 Ko)
Pour en savoir plus
Time series : Indices of agricultural prices
