


 25 June 2014
2014- n° 146In June 2014, the business climate in services is unchanged Monthly survey of services - June 2014
25 June 2014
2014- n° 146In June 2014, the business climate in services is unchanged Monthly survey of services - June 2014
According to business managers, the economic situation in services remains stable in June 2014. The business climate composite indicator is steady and stands at 90, still below its long-term average (100). The turning point indicator remains in a favorable area.
All services sector
According to business managers, the economic situation in services remains stable in June 2014. The business climate composite indicator is steady and stands at 90, still below its long-term average (100). The turning point indicator remains in a favorable area.
Business managers consider that activity has slowed down in the recent period. Their expectations of activity for the next three months have recovered slightly but remain under their long-term average. Their expectations of demand remain pessimistic. The balance on the general outlook, which relates the assessment of business leaders over their whole sector, is unchanged. It remains below its long-term average.
Expectations remain pessimistic about employment
The balances of opinion on past and expected employment are lower than their long-term averages.
tableauTable_quarter – Economic outlook in the services sector
| Average* | March 14 | April 14 | May 14 | June 14 | |
|---|---|---|---|---|---|
| Composite indicator | 100 | 93 | 91 | 90 | 90 |
| General outlook | –8 | –15 | –15 | –17 | –17 |
| Past activity | 2 | –4 | –3 | –2 | –8 |
| Expected activity | 2 | –7 | –12 | –12 | –10 |
| Expected demand | 0 | –6 | –8 | –11 | –12 |
| Business situation | –2 | –10 | –7 | –6 | –10 |
| Past selling prices | –3 | –13 | –10 | –12 | –10 |
| Expected selling prices | –2 | –12 | –9 | –10 | –10 |
| Past employment | 3 | –5 | 3 | 2 | –1 |
| except temporary work agencies | 1 | –4 | 0 | –3 | –4 |
| Expected employment | 2 | –2 | –1 | –5 | –2 |
| except temporary work agencies | –1 | –5 | –3 | –4 | –3 |
| Investments | |||||
| Past investments | 1 | 1 | –3 | –4 | –4 |
| Expected investments | 1 | –6 | –4 | –7 | –3 |
- * Average of the balances of opinion since 1988
- Source: Insee
graphiqueGraph1 – Composite indicator

graphiquegraph_retourn – Turning point indicator

- Note: close to 1 (respectively -1), this indicator indicates a favorable short-term economic situation (respectively unfavorable).
graphiqueGraph2 – Activity

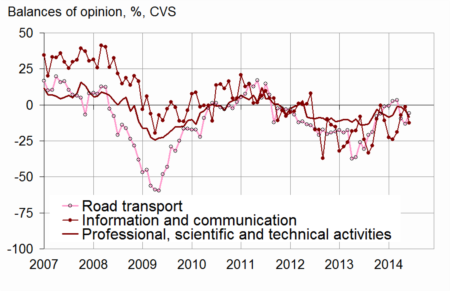
Road transport
In road freight and mail activities, the balance of opinion on past activity has recovered. Conversely, the balance of opinion on expected activity has gone down.
Accommodation and food service activities
In accommodation and food service activities, business managers consider that their activity has slowed down over the recent period. However, their business expectations for the coming months recover sharply.
Information and communication
In information and communication, more business managers than in May consider that their activity has deteriorated over the recent period. Even if they have recovered, their business expectations remain very pessimistic.
Real estate activities
In real estate activities, the balances of opinion on past activity and on expected activity have deteriorated.
Professional, scientific and technical activities
In professional, scientific and technical activities, business managers consider that activity has slowed down in the recent months. Their business expectations are less pessimistic than in May.
Administrative and support service activities
In administrative and support service activities, the balance of opinion on past activity has dropped markedly, while the one relative to expected activity has slightly gone up.
graphiquegraph_bonus_ – Past activity
tableauTable_det – Detailed data
| A21 | Average* | March 14 | April 14 | May 14 | June 14 |
|---|---|---|---|---|---|
| (H) Road transport | |||||
| Past activity | –8 | 3 | –10 | –13 | –6 |
| Expected activity | –9 | –10 | –6 | –8 | –15 |
| Expected demand | –13 | –12 | –13 | –16 | –16 |
| Past employment | –8 | –8 | –10 | –11 | –14 |
| Expected employment | –11 | –11 | –8 | –11 | –10 |
| (I) Accommodation and food service activities | |||||
| Past activity | –7 | –5 | –11 | –9 | –17 |
| Expected activity | –7 | –12 | –9 | –14 | 0 |
| Expected demand | –9 | –29 | –22 | –21 | –10 |
| Past employment | –4 | –4 | –12 | –9 | 0 |
| Expected employment | –5 | –6 | 1 | –15 | 2 |
| (J) Information and communication | |||||
| Past activity | 10 | –19 | –7 | –2 | –13 |
| Expected activity | 11 | –19 | –26 | –28 | –23 |
| Expected demand | 11 | 7 | –7 | –4 | –11 |
| Past employment | 7 | –10 | –2 | –7 | –10 |
| Expected employment | 11 | –1 | 4 | –1 | –4 |
| (L) Real estate activities | |||||
| Past activity | 7 | 11 | 0 | 8 | 4 |
| Expected activity | 7 | 5 | 7 | 10 | 3 |
| Expected demand | 1 | –2 | –2 | –7 | –4 |
| Past employment | 3 | –1 | 8 | –6 | –5 |
| Expected employment | 2 | –5 | –1 | –1 | –1 |
| (M) Professional, scientific and technical activities | |||||
| Past activity | –1 | –1 | –2 | –4 | –8 |
| Expected activity | –2 | –10 | –12 | –9 | –4 |
| Expected demand | –5 | –15 | –12 | –13 | –14 |
| Past employment | 1 | –3 | 1 | 1 | 3 |
| Expected employment | 0 | –5 | –4 | –2 | –5 |
| (N) Administrative and support service activities | |||||
| Past activity | 6 | 2 | 16 | 6 | –5 |
| Expected activity | 5 | 10 | –7 | –5 | –3 |
| Expected demand | 3 | 0 | 0 | –7 | –8 |
| Past employment | 8 | –7 | 15 | 14 | 6 |
| Expected employment | 6 | 4 | –2 | –2 | –1 |
- * Average of the balances of opinion since 1988 (2006 for road transport)
Documentation
Methodology (2016) (pdf,158 Ko)
Pour en savoir plus
Time series : Economic outlook surveys – Services
