


 30 April 2014
2014- n° 101Household consumption on goods increased in March (+0.4%), but decreased over the
first quarter (-1.2%) Household consumption expenditure on goods - March 2014
30 April 2014
2014- n° 101Household consumption on goods increased in March (+0.4%), but decreased over the
first quarter (-1.2%) Household consumption expenditure on goods - March 2014
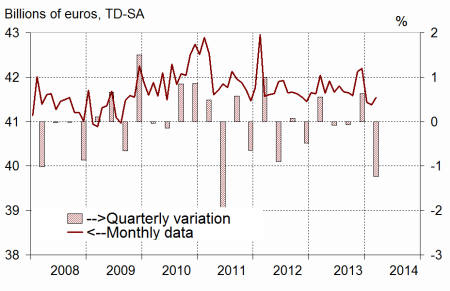
In March, household consumption expenditure on goods increased anew: +0.4% in volume*, after -0.1% in February. A decrease in clothing expenditure partially offsets an increase in consumption of energy products. Taking into account the decrease in January (-1.8%), household consumption expenditure on goods fell over Q1 : -1.2%, after +0.6% at the end of last year. This fall was mainly attributable to decline in consumption of energy products and in car purchases.
- Engineered goods : decreasing slightly
- Durables: almost stable in March, decreasing over the quarter
- Textile-leather: marked decline in March but increase over the quarter
- Other engineered goods: rise in March and over the quarter
- Food products: rising in March but decreasing over Q1
- Energy: increasing
- The evolution of household consumption of goods in February is scaled down by 0.2 points
In March, household consumption expenditure on goods increased anew: +0.4% in volume*, after -0.1% in February. A decrease in clothing expenditure partially offsets an increase in consumption of energy products. Taking into account the decrease in January (-1.8%), household consumption expenditure on goods fell over Q1 : -1.2%, after +0.6% at the end of last year. This fall was mainly attributable to decline in consumption of energy products and in car purchases.
Engineered goods : decreasing slightly
Durables: almost stable in March, decreasing over the quarter
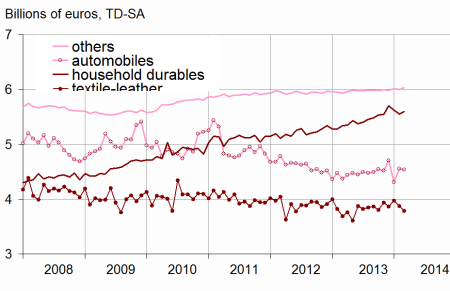
Household expenditure on durable goods almost held steady in March (-0.1%), after a rebound in February (+2.6%). Indeed, expenditures on household durables edged up (+0.8%) but car purchases decreased slightly after a bounce in Februray (-0.5%).
Over the first quarter, expenditure on durable goods declined by 1.3%. The decrease is attributable to car purchases, which decreased by 2.7 % after increasing by 2.3% in Q4 2013, while household durables were almost stable (-0.1 %).
Textile-leather: marked decline in March but increase over the quarter
In March, consumption of textile, clothing and leather stepped back (–2.3%) after a fall in february (-2.6%). Yet it grew over Q1 (+0.3%) for the third consecutive quarter.
[* Volumes are chained and all figures are trading days and seasonally adjusted.]
graphiquegraph1_new_ang – Total consumption of goods
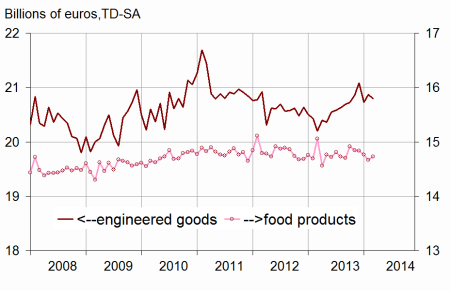
graphiquegraph2_new_ang – Food and engineered goods
graphiquegraph3_new_ang – Breakdown of engineered goods
Other engineered goods: rise in March and over the quarter
Consumption expenditure on other engineered goods recovered in March (–0.5%, after -0.1% in February), particularly in purchases on hardware. It went up slightly in Q1 (+0.5%, after +0.1%).
Food products: rising in March but decreasing over Q1
In March, consumption of food products rose slightly (+0.4% after –0.7% in February). Yet it decreased over the quarter (-1.0%, after +0.8% in Q4).
Energy: increasing
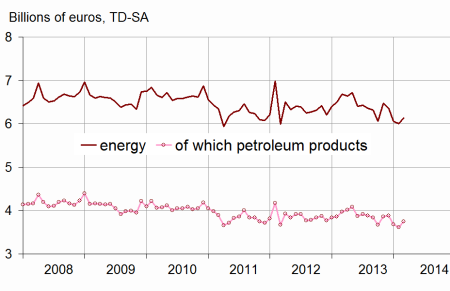
After three months of decrease, household consumption of energy products bounced back in March (+2.3%), reflecting the improvement of fuel expenditure. Over the quarter, consumption of energy products dipped (- 3.6% after –1.1% in Q4) above average temperatures weighing on heating expenditure.
The evolution of household consumption of goods in February is scaled down by 0.2 points
The change of household consumption of goods is now estimated at -0.1% in February, instead of +0.1% estimated for the previous publication. Conversely, household consumption of goods in January is scaled up by 0.3 points to -1.8%.
This revision is mainly due to the updating of the seasonal adjustment coefficients in textile-leather and energy.
graphiquegraph4_new_ang – Energy
tableauenglish_trim – Household consumption expenditure on goods
| Jan. | Feb. | March | March2014/ | Q1 14/ | |
|---|---|---|---|---|---|
| 2014 | 2014 | 2014 | March2013 | Q4 13 | |
| Food products | 14,768 | 14,669 | 14,727 | ||
| Change (%) | –0,5 | –0,7 | 0,4 | –2,2 | –1,0 |
| Engineered goods | 20,728 | 20,870 | 20,795 | ||
| change (%) | –1,7 | 0,7 | –0,4 | 2,9 | –0,4 |
| Durables | 10,731 | 11,010 | 11,000 | ||
| change (%) | –4,8 | 2,6 | –0,1 | 3,9 | –1,3 |
| Of which Automobiles | 4,302 | 4,558 | 4,537 | ||
| Change (%) | –8,5 | 5,9 | –0,5 | 3,9 | –2,7 |
| Of which household durables | 5,621 | 5,553 | 5,597 | ||
| Change (%) | –1,4 | –1,2 | 0,8 | 4,7 | –0,1 |
| Textile-leather | 3,975 | 3,873 | 3,786 | ||
| Change (%) | 2,9 | –2,6 | –2,3 | 2,7 | 0,3 |
| Other engineered goods | 6,009 | 6,001 | 6,029 | ||
| Change (%) | 0,4 | –0,1 | 0,5 | 1,6 | 0,5 |
| Energy | 6,056 | 5,997 | 6,134 | ||
| Change (%) | –4,7 | –1,0 | 2,3 | –8,3 | –3,6 |
| Including petroleum products | 3,676 | 3,611 | 3,749 | ||
| Change (%) | –5,2 | –1,8 | 3,8 | –5,6 | –3,2 |
| Total | 41,431 | 41,380 | 41,545 | ||
| Change (%) | –1,8 | –0,1 | 0,4 | –1,2 | –1,2 |
| Manufactured goods | 36,080 | 36,044 | 36,222 | ||
| Change (%) | –1,6 | –0,1 | 0,5 | 0,6 | –0,8 |
Documentation
Methodology (pdf,23 Ko)
Pour en savoir plus
