


 26 June 2013
2013- n° 146In Q1 2013, French GDP decreased again (-0.2% after -0.2%),households’ purchasing
power upturned (+1.0% after -0.9%) Quarterly national accounts - detailed figures - 1st Quarter 2013
26 June 2013
2013- n° 146In Q1 2013, French GDP decreased again (-0.2% after -0.2%),households’ purchasing
power upturned (+1.0% after -0.9%) Quarterly national accounts - detailed figures - 1st Quarter 2013
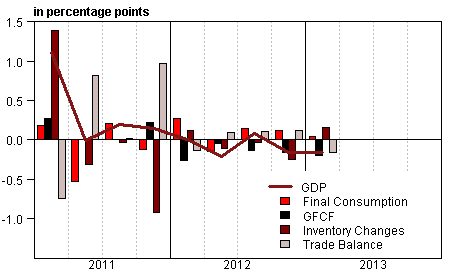
In Q1 2013, as in Q4 2012, French growth domestic product (GDP) in volume* decreased by 0.2%.
In Q1 2013, as in Q4 2012, French growth domestic product (GDP) in volume* decreased by 0.2%.
Household consumption expenditure was almost stable (–0.1% after +0.1%), meanwhile gross fixed capital formation (GFCF) dropped again (–1.0% after –0.8%). Overall, total domestic expenditure (excluding change in inventories) weighed down on GDP growth: –0.2 point after 0.0 point. Imports slightly increased (+0.2% after –1.0%), while exports were still diminishing (–0.4% after –0.7%). Hence foreign trade balance contributed negatively to GDP growth (–0.2 point after +0.1 point in Q4 2012). Finally, changes in inventories contributed slightly to GDP growth in Q1 2013: +0.2 point after –0.2 point in Q4 2012.
Households’ purchasing power renewed with growth
In Q1 2013, households’ disposable income (HDI) upturned: in nominal terms it increased by 1.3% after a step back in Q4 2012 (–0.7%). Taxes on income and wealth markedly decreased (–4.9%), following a strong H2 2012 (+4.1% in 2012 Q3 and +7.4% in Q4). This dynamic result was mainly due to measures increasing the income tax in 2012, and to the exceptional contribution for solidarity tax on wealth at year-end. Moreover, wages received by households slightly accelerated in Q1 (+0.4% after +0.2%), meanwhile social benefits in cash rose almost at the same rate as in the previous quarter (+0.7% after +0.8%).
* This growth rate is seasonally and trading-day adjusted; volumes are chain-linked previous-year-prices volumes.
graphiqueGraph1 – GDP and its main components
tableauTab1 – GOODS AND SERVICES: SUPPLY AND USES CHAIN-LINKED VOLUMES
| 2012 Q2 | 2012 Q3 | 2012 Q4 | 2013 Q1 | 2012 | 2013 (ovhg) | |
|---|---|---|---|---|---|---|
| GDP | -0.2 | 0.1 | -0.2 | -0.2 | 0.0 | -0.3 |
| Imports | 0.1 | 0.0 | -1.0 | 0.2 | -0.9 | -0.6 |
| Households' consumption *expenditure | -0.5 | 0.1 | 0.1 | -0.1 | -0.4 | -0.1 |
| General government's *consumption expenditure | 0.5 | 0.3 | 0.3 | 0.4 | 1.4 | 0.9 |
| GFCF | -0.2 | -0.7 | -0.8 | -1.0 | -1.2 | -2.0 |
| *of which Non financial corporated and unincorporated enterprises | -0.2 | -0.9 | -0.8 | -1.0 | -1.9 | -2.1 |
| Households | -0.2 | -0.3 | -0.9 | -1.4 | -0.4 | -2.3 |
| General government | 0.2 | -0.5 | -0.9 | -0.7 | -0.6 | -1.6 |
| Exports | 0.5 | 0.3 | -0.7 | -0.4 | 2.5 | -0.7 |
| Contributions: | ||||||
| Internal demand excluding inventory changes | -0.2 | 0.0 | 0.0 | -0.2 | -0.1 | -0.2 |
| Inventory changes | -0.1 | 0.0 | -0.2 | 0.2 | -0.8 | -0.1 |
| Net foreign trade | 0.1 | 0.1 | 0.1 | -0.2 | 1.0 | 0.0 |
tableauTab2 – Sectoral accounts
| 2012 Q2 | 2012 Q3 | 2012 Q4 | 2013 Q1 | 2012 | 2013 (ovhg) | |
|---|---|---|---|---|---|---|
| Profit ratio of NFC* (level) | 28.4 | 28.5 | 28.0 | 28.1 | 28.3 | |
| Household purchasing power | 0.1 | -0.1 | -0.9 | 1.0 | -0.9 | 0.3 |
- *NFC: non-financial corporations
tableauTab3 – GDP and components: prices indices
| 2012 Q2 | 2012 Q3 | 2012 Q4 | 2013 Q1 | 2012 | 2013 (ovhg) | |
|---|---|---|---|---|---|---|
| GDP | 0.5 | 0.3 | 0.3 | 0.6 | 1.5 | 1.1 |
| Imports | 0.2 | 0.1 | 0.3 | -0.6 | 1.9 | -0.2 |
| Cons. Exp.: | ||||||
| - Households | 0.2 | 0.1 | 0.2 | 0.3 | 1.9 | 0.6 |
| - GG* | 0.2 | 0.3 | 0.2 | 0.2 | 1.1 | 0.5 |
| Total GFCF | 0.4 | 0.0 | 0.1 | 0.5 | 1.7 | 0.7 |
| - of which Households | 0.8 | -0.5 | -0.1 | 0.5 | 2.3 | 0.4 |
| - of which NFE | 0.2 | 0.1 | 0.2 | 0.6 | 1.3 | 0.9 |
| - of which GG | 0.3 | 0.4 | 0.3 | 0.2 | 2.2 | 0.7 |
| Exports | -0.3 | 0.9 | 0.2 | -0.2 | 1.2 | 0.3 |
- *GG: General Government
tableauTab4 – Manufactured goods: supply and uses in volume
| 2012 Q2 | 2012 Q3 | 2012 Q4 | 2013 Q1 | 2012 | 2013 (ovhg) | |
|---|---|---|---|---|---|---|
| Industrie’s production | -1.3 | 0.9 | -2.1 | -0.1 | -2.8 | -1.6 |
| - of which value added | -1.0 | 0.5 | -1.7 | -0.5 | -2.0 | -1.7 |
| Imports | 1.4 | -1.2 | -1.0 | 0.3 | 0.3 | -0.7 |
| Intermediate uses | -0.9 | 0.4 | -1.1 | -0.4 | -1.8 | -1.3 |
| Cons. Exp.: | ||||||
| - of households | -0.9 | 0.5 | -0.1 | -0.9 | -1.2 | -1.0 |
| - of GG | 0.8 | 0.3 | 1.4 | 1.9 | 4.3 | 3.4 |
| Total GFCF | -0.9 | -0.6 | -1.8 | -1.4 | -3.0 | -3.2 |
| - of which NFC | -0.9 | -0.7 | -2.0 | -1.6 | -3.7 | -3.7 |
| - of which GG | -0.5 | -0.3 | -0.1 | 0.0 | 1.0 | -0.4 |
| Exports | 0.3 | 0.9 | -1.4 | -0.4 | 3.0 | -1.0 |
| Inventory changes (contribution) | 0.4 | -0.8 | -0.6 | 1.1 | -2.5 | 0.3 |
tableauTab5 – Households’ disposable income and ratios of households’ account
| 2012 Q2 | 2012 Q3 | 2012 Q4 | 2013 Q1 | 2012 | 2013 (ovhg) | |
|---|---|---|---|---|---|---|
| HDI | 0.3 | 0.0 | -0.7 | 1.3 | 0.9 | 0.8 |
| Household purchasing power | 0.1 | -0.1 | -0.9 | 1.0 | -0.9 | 0.3 |
| HDI by cu* (purchasing power) | -0.1 | -0.2 | -1.0 | 0.8 | -1.5 | -0.1 |
| Adjusted HDI (purchasing power) | 0.1 | 0.0 | -0.6 | 0.8 | -0.4 | 0.4 |
| Saving ratio (level) | 16.0 | 15.9 | 15.1 | 16.0 | 15.6 | |
| Financial saving ratio (level) | 6.5 | 6.5 | 5.7 | 6.8 | 6.2 |
- *cu: consumption unit
tableauTab6 – Ratios of non-financial corporations’ account
| 2012 Q2 | 2012 Q3 | 2012 Q4 | 2013 Q1 | 2012 | |
|---|---|---|---|---|---|
| Profit share | 28.4 | 28.5 | 28.0 | 28.1 | 28.3 |
| Investment ratio | 19.5 | 19.3 | 19.2 | 19.0 | 19.4 |
| Saving ratio | 13.1 | 13.0 | 12.0 | 12.5 | 12.8 |
| Self-financing ratio | 67.0 | 67.3 | 62.4 | 65.6 | 65.9 |
Consumption prices slightly increased in Q1 (+0.3% after +0.2% in Q4 2012), therefore households’ purchasing power rose by 1.0% after a step back at the end of 2012 (–0.9%). Taken individually (measured per consumption unit), it increased by 0.8% after a 1.0% drop in Q4 2012.
Households’ disposable income (HDI) renewed with growth at the beginning of 2013, whereas households’ consumption in value grew slightly (+0.2% as in the previous quarter). Consequently, the saving ratio bounced after a drop in Q3 and Q4 2012. It reached 16.0%, its 2012 spring level, after 15.1% at the end of 2012.
Non-financial corporations’ profit ratio marginally increased
In Q1 2013, non-financial corporations’ nominal value added accelerated (+0.4% after –0.1%), thanks to a decrease in intermediate consumption prices. Compensations of employees grew less than in the previous quarter (+0.2% after +0.3%). Wages slightly accelerated at the beginning of 2013 (+0.4% after +0.1% in Q4), as employment (-0.1% after –0.3%) and average wage per capita (+0.5% after +0.4%). On the contrary, employers’ social contributions decreased after a strong end-2012 (–0.3% after +0.8%). Moreover, taxes on production decelerated (+0.7% after +3.4%) after being dynamic at the end of 2012 due to the increase of the “forfait social” (corporate social contribution) rate.
All in all, gross operation surplus of non-financial corporations renewed with growth (+0.7% after –1.7%) and non-financial corporations’ profit ratio increased by 0.1% to reach 28.1%.
The GDP step back is confirmed
Since the previous release, (« preliminary figures », on May 15, 2013), GDP step back estimation is confirmed in 2013 Q1 and in the previous quarter. Some components are marginally revised but revisions offset each other. They are due to the integration of data released since then or to the revision of some indicators in the past.
Pour en savoir plus
