


 14 November 2013
2013- n° 262In October 2013, prices of frequently purchased goods in hyper and supermarkets decreased
by 0.2% Price Index in large and predominantly-food stores - October 2013
14 November 2013
2013- n° 262In October 2013, prices of frequently purchased goods in hyper and supermarkets decreased
by 0.2% Price Index in large and predominantly-food stores - October 2013
In hyper and supermarkets, the prices of frequently purchased goods decreased by 0.2% in October 2013, as in September 2013.
- Year-on-year, prices declined by 0.1% in the hyper and supermarkets
- Prices decreased by 0.3% in the hypermarkets and by 0.1% in the supermarkets in October 2013
- Excluding fresh foodstuffs, the food prices decreased by 0.2% in the hyper and supermarkets in October
- The prices of cleaning and personal care products decreased again in October 2013 in the hyper and supermarkets
In hyper and supermarkets, the prices of frequently purchased goods decreased by 0.2% in October 2013, as in September 2013.
Year-on-year, prices declined by 0.1% in the hyper and supermarkets
In October 2013, the prices of frequently purchased goods were 0.1% lower than those of October 2012 in the hyper and supermarkets (after +0.2% in the year to September 2013). In October 2012, they were up 1.2%, year–on–year.
Prices decreased by 0.3% in the hypermarkets and by 0.1% in the supermarkets in October 2013
In hypermarkets, the prices of frequently purchased goods were down 0.3% in October 2013 after a decrease by 0.2% in September 2013.
In the year to October 2013, the prices of frequently purchased goods in hypermarkets went down by 0.4%; they were up 0.2% in September 2013, year–on–year. In October 2012, they increased by 1.0%, year–on–year.
In supermarkets, the prices of frequently purchased goods were down 0.1% in October 2013 after a fall of 0.3% in September 2013.
Between October 2012 and October 2013, the prices of frequently purchased goods in supermarkets rose by +0.2% (after +0.4% in September 2012 and +0.5% in August 2013, year–on–year). They increased by 1.4% between October 2011 and October 2012.
graphiqueGraphique1 – Frequently purchased goods price indexes - annual changes (%)
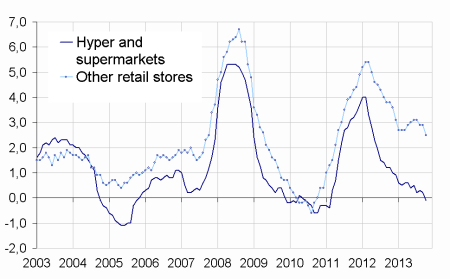
- Source : INSEE – Consumer Price Indexes
graphiqueGraphique2 – Frequently purchased goods price indexes
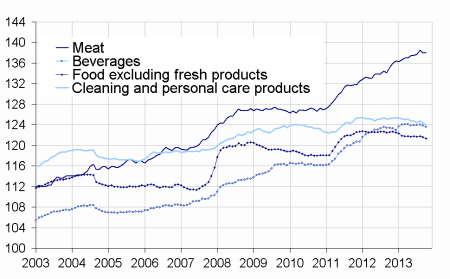
- Source : INSEE – Consumer Price Indexes. base 100 : 1998
tableauTableau1 – Prices of frequently purchased goods
| Variations (%) over | |||
|---|---|---|---|
| Index October 2013 | one month | Index October 2013 | |
| Hyper-and-Supermarkets (A) | 125.9 | –0.2 | –0.1 |
| - Hypermarkets | 124.9 | –0.3 | –0.4 |
| - Supermarkets | 127.7 | –0.1 | 0.2 |
| Large and predominantly food stores (A + neighborhood stores) | 127.5 | –0.2 | 0.0 |
| Other | 137.9 | –0.1 | 2.5 |
| Total | 129.7 | –0.1 | 0.5 |
- Source : INSEE – Consumer Price Indexes
tableauTableau2 – Prices of frequently purchased goods detailed by main items
| Variations (%) over | |||
|---|---|---|---|
| Index October 2013 | one month | Index October 2013 | |
| Food and beverages (excluding fresh foodstuffs) | 126.4 | –0.2 | 0.1 |
| - Meat | 138.1 | 0.1 | 2.1 |
| - Beverages | 123.6 | –0.2 | 0.2 |
| - Other food products | 121.3 | –0.2 | –1.1 |
| Clearing and personal care products | 124.0 | –0.2 | –1.0 |
| Total : Hyper-and-Supermarkets | 125.9 | –0.2 | –0.1 |
- Source : INSEE – Consumer Price Indexes
Excluding fresh foodstuffs, the food prices decreased by 0.2% in the hyper and supermarkets in October
Excluding fresh foodstuffs, the food and beverage prices declined by 0.2% in the hyper and supermarkets in October 2013 as in September 2013. They slowed down and were almost stable in October 2013 (+0.1% year–on–year, after +0.5% in the year to September 2013). In October 2012, the food and beverage prices (excluding fresh foodstuffs) grew by 1.4% compared with the same month one year ago.
In October 2013, the meat prices were up slightly (+0.1%) in the hyper and supermarkets (after —0.4% in september 2013). They decelerated : their annual rate of change were down from +2.9% in September 2013 to +2.1% in October 2013. In October 2012, they increased by 2.6%, year–on–year.
In the hyper and supermarkets, beverage prices decreased by 0.2% in October 2013, as in September 2013, due to the pursuit in the downturn of non-alcoholic beverage prices. In the year to October 2013, beverage prices rose by 0.2% after +0.3% in September and August 2013. In October 2012, they rose by 2.5%, year–on–year.
In October 2013, the prices of the other food products (excluding fresh foodstuffs) decreased by 0.2% in hyper and supermarkets, as in September 2013. In the year to October 2013, they fell by 1.1%, down from —0.7% in September 2013. In October 2012, they rose by 0.3%, year–on–year.
The prices of cleaning and personal care products decreased again in October 2013 in the hyper and supermarkets
In October 2013, the prices of cleaning and personal care products went down by 0.2% in the hyper and supermarkets while they already decreased by 0.3% in September 2013. They went down by 1.0%, year–on–year (after —0.6% in September 2013). In October 2012, they declined by 0.4% compared with the same month one year ago.
Pour en savoir plus
