


 12 September 2013
2013- n° 2082The Consumer Prices Index increased by 0.5% in August 2013; it rose by 0.9% year-on-year Consumer price index - final results - August 2013
12 September 2013
2013- n° 2082The Consumer Prices Index increased by 0.5% in August 2013; it rose by 0.9% year-on-year Consumer price index - final results - August 2013
The Consumer Price Index (CPI) was up 0.5% in August 2013 after a decrease by 0.3% in July 2013. Seasonally adjusted, the CPI increased by 0.2% in August 2013. The CPI annual growth rate was 0.9 % in August 2013, down from + 1.1 % in July 2013. Excluding tobacco, the CPI grew by 0.4% in August 2013 and by 0.7% compared with the same month one year ago.
- Monthly change: + 0.5%; Year on year: + 0.9%
- Increases in manufactured product prices at the end of the summer sales
- Seasonal increase in the service prices
- Pursuit of the rebound in energy prices
- Seasonal fall in food prices as a result of the decline in fresh foodstuff prices
- The core inflation stabilized in August
Monthly change: + 0.5%; Year on year: + 0.9%
The Consumer Price Index (CPI) was up 0.5% in August 2013 after a decrease by 0.3% in July 2013. Seasonally adjusted, the CPI increased by 0.2% in August 2013. The CPI annual growth rate was 0.9 % in August 2013, down from + 1.1 % in July 2013. Excluding tobacco, the CPI grew by 0.4% in August 2013 and by 0.7% compared with the same month one year ago.
In August 2013, the largest contributions to the rise in the CPI came from seasonal increases in the manufactured product prices at the end of the summer sales in metropolitan France and in some services related to tourism at the time of the summer holidays. The pursuit of the rebound in energy prices and the increase in tobacco prices (on the 15th of July) has also contributed to the CPI growth in August 2013. Those rises were reduced by the seasonal decrease in prices of fresh foodstuffs.
Increases in manufactured product prices at the end of the summer sales
Prices of manufactured goods increased by 1.1% in August 2013 (+ 1.2% in August 2012) but dropped by 0.6% year on year. After the end of he summer sales, prices of clothing and footwear increased by 6.9% in August 2013 (+ 1.6% year on year) after a fall of 13.2% in July. The largest increases in prices concerned especially clothing and footwear for children (lingerie and hosiery + 13.2% in August and + 1.4%, year on year - clothes + 11.8% in August and + 3.0%, year on year). Some price increases due to the end of summer sales were also observed for the leather goods and the travel goods (+ 4.6%; + 1.7% compared with the same month one year ago), the furniture and furnishings (+ 2.2%; + 0.6% year on year) and for jewellery, clocks and watches (+ 1.3%; + 0.7% year-on year). Moreover, the price drop of certain manufactured products continued, especially for audiovisual, photographic and information processing equipment (— 0.3%, — 8.2% year on year).
tableauOLE_LINK2 – Detailed figures for various groups
| Items | Weight 2013 | Index Aug. 2013 | Month rate (%) | Annual rate (%) |
|---|---|---|---|---|
| a) All households - France | ||||
| All items (00 E) | 10000 | 127,73 | 0,5 | 0,9 |
| All items SA (00 C) | 10000 | 127,60 | 0,2 | 0,9 |
| Food (4000 E) | 1658 | 132,74 | –0,4 | 1,8 |
| Fresh food (4001 E) | 210 | 142,07 | –4,7 | 7,6 |
| Food excluding fresh products (4002 E) | 1448 | 131,41 | 0,2 | 1,0 |
| Tobacco (4034 E) | 206 | 249,80 | 1,5 | 10,5 |
| MANUFACTURED PRODUCTS (4003 E) | 2738 | 100,12 | 1,1 | –0,6 |
| Clothing and footwear (4004 E) | 458 | 103,89 | 6,9 | 1,6 |
| Medical products (4005 E) | 455 | 80,48 | –0,1 | –3,3 |
| Other manufactured products (4006 E) | 1825 | 104,02 | 0,1 | –0,4 |
| ENERGY (4007 E) | 822 | 179,88 | 1,4 | –0,3 |
| Petroleum products (4008 E) | 495 | 207,15 | 0,7 | –4,3 |
| SERVICES (4009 E) | 4576 | 135,36 | 0,2 | 1,1 |
| Actual rentals and services for dwellings (4010 E) | 748 | 139,73 | 0,1 | 1,8 |
| Medical services (4011 E) | 542 | 121,40 | –0,7 | 0,0 |
| Transport and communication services (4012 E) | 506 | 97,36 | 0,0 | –4,6 |
| Other services (4013 E) | 2780 | 146,08 | 0,4 | 2,2 |
| ALL ITEMS EXCLUDING RENTALS AND TOBACCO (5000 E) | 9202 | 125,31 | 0,5 | 0,6 |
| ALL ITEMS EXCLUDING TOBACCO (4018 E) | 9794 | 125,90 | 0,4 | 0,7 |
| b) Manual or clerical worker headed urban households - France | ||||
| ALL ITEMS EXCLUDING TOBACCO (4018 D) | 9704 | 125,74 | 0,4 | 0,7 |
| ALL ITEMS (00 D) | 10000 | 128,41 | 0,5 | 1,0 |
| c) Households that belong to the lowest equivalized disposable income quintile - France | ||||
| ALL ITEMS EXCLUDING TOBACCO (4018 Q) | 9674 | 127,22 | 0,4 | 0,7 |
- Source : Insee - Consumer Price Indexes
tableauTableau1English – Detailed figures for Core inflation* and HICP**
| Percentage change | ||||
|---|---|---|---|---|
| Items | Weight 2013 | Index Aug. 2013 | Month rate | Annual rate |
| All items "Core inflation" (4022 S) | 6085 | 122,44 | 0,0 | 0,6 |
| Food excluding fresh products, meat, milk and exotic products (4019 S) | 715 | 126,04 | 0,0 | 0,1 |
| Manufactured products (4020 S) | 2217 | 105,22 | 0,0 | 0,0 |
| Services including actual rentals and services for dwellings (4021 S) | 3153 | 138,43 | 0,3 | 0,9 |
| All items HICP (00 H) | 115,36 | 0,5 | 1,0 | |
- * ISJ : Core inflation indicator excludes public sector prices, the most volatile consumer prices and the tax measures. This index is seasonally adjusted. This index is calculated for all households in France excluding overseas departments and territories (base 100 1998).
- **HICP : Harmonised Indices of Consumer Prices are inflation figures required under the Treaty on the functioning of the European Union. They are designed for international comparison of consumer price inflation between Member states of the Union. This index is calculated for all households in France (base 100 2005).
- Source : Insee - Consumer Price Indexes
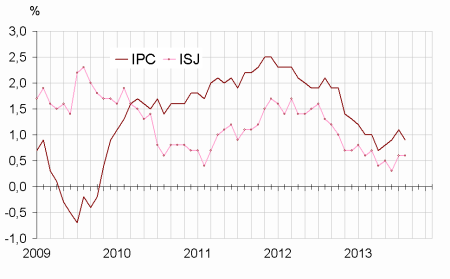
graphiqueGraphique1English – Consumer price index (IPC) and Core inflation (ISJ) – year-on-year changes
- Source : Insee - Consumer Price Indexes
Seasonal increase in the service prices
In August 2013, service prices rose by 0.2% (+ 1.1% compared with the same month one year ago), mainly as a result of the seasonal increase in the prices of holiday accommodation services (+ 14.6%; + 2.0% year on year) and in the prices of package holidays (+ 6.7% in August; + 0.4% year on year). Moreover, the tariffs of passenger airfares went up in August (+ 0.5% in August; + 0.3% year on year). Conversely, the prices of hotels and boarding houses (— 2.0%; + 0.5% year on year) and those of toll facilities and parking meters, consequence of free car parking in several cities (— 1,5%; + 1,6 % year on year) decreased in August 2013. In addition, telecommunication service prices slipped again in August (— 0.4%, — 11.7% year on year).
Pursuit of the rebound in energy prices
In August 2013, energy prices rose for the second straight month (+ 1.4% after + 0.3% in July 2013). The main contribution to this increase came from the sharp increase in the price of electricity (+ 4.0% all taxes included in August; + 7.5% year on year) and, but to a lesser extent, from those of the petroleum products (+ 0.7%, + 0.5% for heating fuel and + 0.7% for motor fuels). Compared with one year ago, the prices of petroleum products were down 4.3% in August 2013 (after + 0.1% in July 2013), consequence of the release of the sharp increase recorded in August 2012 (+ 5.3%). On the contrary, city gas prices fell slightly in August 2013 (— 0.4%; + 2.8% year on year).
Seasonal fall in food prices as a result of the decline in fresh foodstuff prices
In August 2013, the food prices decreased by 0.4% (+ 1.8% year on year, like in July 2013). This decline came essentially from the seasonal decrease in the prices of fresh products (— 4.7% in August). However, due to the adverse weather conditions during the first semester which have reduced supply, the prices of these products remained largely higher compared with those observed one year ago (+ 12.0% for fresh fruits and + 5.3% for fresh vegetables. + 7.6% on average). Excluding fresh foodstuffs, food prices have only changed a little (+ 0.2% in August; + 1.0% year on year) which hides contrasted developments considering the different consumption sectors. Thus, only the price of meat (+ 0.5%; + 3.2% year on year) and those of alcoholic beverages (+ 0.3%; + 3.0% year on year) remained dynamic. On the other hand, the prices of soft drinks declined sharply (—1.6% year on year) in relation to the fall in prices of coffee, tea and cocoa (— 1.7% year on year) and mineral waters (— 2.9% compared with the same month one year ago).
The core inflation stabilized in August
In August 2013, the core inflation indicator (ISJ) is stable and its annual growth rate reached + 0.6% (like in July 2013). The harmonized Index of Consumer prices (HICP) increased by 0.5% in August 2013 and by 1.0% compared with the same month one year ago (+ 1.2% in July 2013).
Pour en savoir plus
