


 29 March 2013
2013- n° 74At the end of Q4 2012, the public debt reaches 1833.8 billion euros Debt of the general government according to the Maastricht definition - 4th Quarter
2012
29 March 2013
2013- n° 74At the end of Q4 2012, the public debt reaches 1833.8 billion euros Debt of the general government according to the Maastricht definition - 4th Quarter
2012
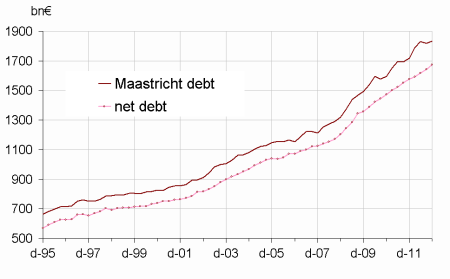
At the end of Q4 2012, the public Maastricht debt, which is a gross debt, reached €1833.8bn, a €15.8bn rise in comparison to Q3 2012. As a percentage of GDP, it peaked at 90.2 %, 0.3 point higher compared to Q3 2012. Furthermore, the net public debt rose by €32.2bn.
The public debt increased by €15.8 bn during the fourth quarter of 2012…
At the end of Q4 2012, the public Maastricht debt, which is a gross debt, reached €1833.8bn, a €15.8bn rise in comparison to Q3 2012. As a percentage of GDP, it peaked at 90.2 %, 0.3 point higher compared to Q3 2012. Furthermore, the net public debt rose by €32.2bn.
…driven by a rise in the State’s and local governement’s debts…
Central Government contribution to debt went up by €18.7bn in the fourth quarter. The State paid back short-term treasury bills (-€10.7bn) but issued bonds for a net value of €16.4bn (of which €12.5bn of medium-term bonds). The Trésor deposit liabilities went up by €5.4bn and the State borrowed €7.7bn on behalf of the EFSF.
Local government contribution to debt increased by €11.7bn. In order to present a balanced budget, the local administrations subscribed long-term loans (+€12.6bn)
…and more moderately by a reduction in social security funds debt.
Social security funds contribution to debt declined by €14.6bn. Cades went out of €15.6bn debt, including €12.9bn short-term bills. Unedic and Acoss also reduced their debt for respectively €4.2bn and €0.9bn. On the other hand, Hospitals and MSA borrowed respectively for €2.4bn and €2.1bn whereas Acoss’ debt increased by €1.9bn.
Central government agencies (Odac) contribution to debt remained steady (+€0.1bn).
graphiqueGraphIR – General government debt under the Maastricht criteria (% of GDP) (*)

tableauTableauA – The debt of the general government according to the Maastricht definition at the end of Q2 2009 by sub-sector and by instrument category
| 2011Q4 | 2012Q1 | 2012Q2 | 2012Q3 | 2012Q4 | |
|---|---|---|---|---|---|
| General government | 1716.9 | 1789.2 | 1832.4 | 1818.0 | 1833.8 |
| % of GDP | 85.4% | 86.0% | 89.3% | 91.0% | 89.9% |
| of which, by sub-sector : | |||||
| State | 1335.3 | 1383.8 | 1435.1 | 1421.2 | 1439.9 |
| Central agencies | 10.4 | 10.0 | 9.7 | 9.8 | 9.9 |
| Local government | 166.6 | 161.2 | 161.6 | 162.1 | 173.7 |
| Social security funds | 204.6 | 234.2 | 226.0 | 224.9 | 210.3 |
| of which, by category : | |||||
| Currency and deposits | 30.1 | 31.5 | 30.8 | 32.3 | 37.7 |
| Securities other than shares | 1471.5 | 1540.5 | 1571.6 | 1556.5 | 1546.1 |
| short-term | 226.1 | 236.2 | 225.7 | 214.1 | 191.6 |
| long-term | 1245.4 | 1304.2 | 1345.9 | 1342.4 | 1354.4 |
| Loans | 215.3 | 217.2 | 230.0 | 229.1 | 250.0 |
| short-term | 8.2 | 9.7 | 11.4 | 8.7 | 8.1 |
| long-term | 207.1 | 207.6 | 218.6 | 220.4 | 242.0 |
- (*) Explanations in the box « For more details »
- Source : National Accounts 2005 basis - Insee, DGFiP, Banque de France
The net public debt still increases
At the end of Q4 2012, the net public debt peaked at €1 675.1bn (amounting to 82.4 % of GDP vs. 81.3 % in the previous quarter), a €32.2bn increase compared to the previous quarter. The €16.4bn gap between changes in net and gross debt is explained by the strong decline of social security funds cash reserves (-€17.6bn of which -€13.8bn for Cades) and the State’s one (-€5.9bn). Conversely, loans held by public administrations have gone up by €7.4bn : the State granted €7.7bn in long-term loans to Greece and Portugal within the EFSF framework.
tableauTableauB – The public debt net at the end of trimester and its assesment by sub-sector
| 2011Q4 | 2012Q1 | 2012Q2 | 2012Q3 | 2012Q4 | |
|---|---|---|---|---|---|
| General government | 1575.2 | 1593.2 | 1619.0 | 1642.9 | 1675.1 |
| of which : | |||||
| State | 1271.2 | 1289.6 | 1314.5 | 1330.9 | 1348.1 |
| Central agencies | –2.0 | –2.6 | –3.0 | –3.3 | –2.9 |
| Local government | 157.0 | 151.6 | 151.9 | 152.3 | 163.9 |
| Social security funds | 149.0 | 154.7 | 155.5 | 163.0 | 166.1 |
graphiqueGraph_dette_nette – Debt under the Maastricht criteria and net debt
The value of quoted shares and mutual fund shares decreases
At the end of Q4 2012, the value of quoted shares and mutual fund shares held by general government reached €170.8bn, a €5.2bn drop from the end of Q3.
The amount of quoted shares held by the State fell by €3.9bn, linked to energy companies stock prices. The value of mutual fund shares held by social security funds decreased by €5.4bn. Nonetheless, this fall is counterbalanced by the rise of quoted shares held by central agencies (+€0.9bn) and social security administrations(+€3.3bn including +€1.6bn for FRR).
tableauTableauC – Listed shares and UCITS shares held by the general government
| 2011Q4 | 2012Q1 | 2012Q2 | 2012Q3 | 2012Q4 | |
|---|---|---|---|---|---|
| General government | 169.7 | 171.2 | 169.4 | 176.0 | 170.8 |
| of which : | |||||
| State | 59.1 | 56.2 | 55.7 | 52.8 | 48.8 |
| Central agencies | 22.2 | 24.4 | 23.5 | 24.6 | 25.5 |
| Local government | 0.6 | 0.6 | 0.6 | 0.7 | 0.7 |
| Social security funds | 87.8 | 89.9 | 89.6 | 97.9 | 95.8 |
graphiqueGraph_F5 – Listed shares and UCITS held by general government

Pour en savoir plus
