


 30 April 2013
2013- n° 106Overall producer prices of agricultural products increased in March Indices of agricultural prices - March 2013
30 April 2013
2013- n° 106Overall producer prices of agricultural products increased in March Indices of agricultural prices - March 2013
In March 2013, overall producer prices increased (+0.6 % compared to February) ; over one year they rose by 7.1 %.
Foreword : starting from March 2013, the indices of agricultural prices are based on year 2010. They have also been re-referenced to 100 for average year 2010. The new series start in January 2005.
In March 2013, overall producer prices increased (+0.6 % compared to February) ; over one year they rose by 7.1 %.
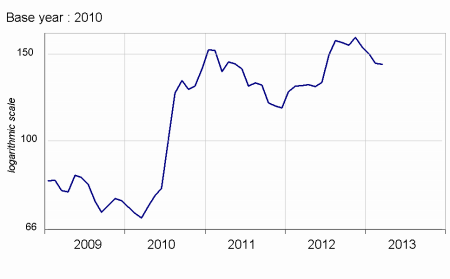
Cereals prices did not change much this month (–0.4 %). The good forecast of crops of wheat and maize in 2013 weighed slightly on the prices.
graphiquecereal – Producer price of cereals
Oleaginous prices showed a slight increase in March (+0.5 %). The cold weather which had been going on slowed the growing of rape, but the demand for grinding stayed moderate. Moreover, problems in Brazil in the supply chain troubled the deliveries of soy.
Potato prices doubled in March compared to the same month last year (+98.6 %), due to a marked shortfall of supply in North-Western Europe.
The wines were more expensive in March (+1.1 %). Over one year their prices surged by more than 10 %. The prices, for some of them with protected designation of origin, were sustained by the export demand. The less significant crop last autumn led to a rise in prices for common wines.
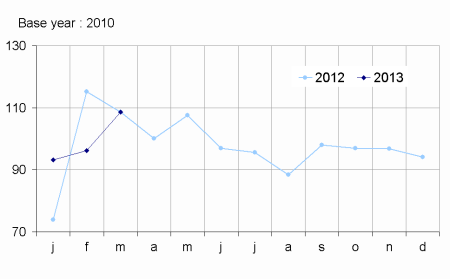
Fresh fruits prices leapt sharply year-over-year (+39.9 %). The price af apple increased by 52 % due to a considerable slump in production in Europe. Kiwi became more expensive too, but less noticeably.
graphiquevegetable – Producer price of fresh vegetables
- Source : SSP (Ministry of Agriculture)
The prices of fresh vegetables increased year-over-year (+2.3 %). The late arrival of spring hindered the consumption of salad while it favoured these of leeks and cauliflowers, which are usually more consumed during the cold season. The supply is less abundant this year for onions.
graphiquepig – Producer prices of pigs and large cattle
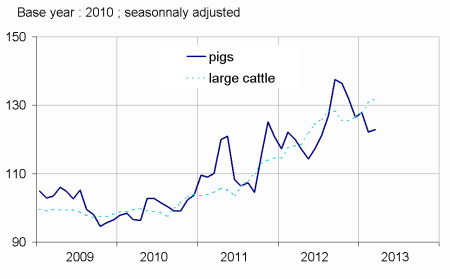
On a seasonally adjusted basis, price of animals increased a little in March (+0.5 %). Prices of big cattle rose due to a decreasing supply. Pig prices showed a more contained increase as a result of the limitation of the export demand. The early calendar for easter celebrations sped up the demand for sheep. Egg prices kept on tumbling, decreasing halfly year-over-year. The strong rebound of supply is the consequence of the recovery of the production capacities.
tableauTab1 – Indices of producer prices of agricultural products (IPPAP)
| Variation as % over | |||||
|---|---|---|---|---|---|
| weights | March 2013 | a month | 3 month | a year | |
| raw | seasonally adjusted data | raw | |||
| Agricultural goods output | 1000 | 123.1 | +0.6 | –1.8 | +7.1 |
| excluding fruits and vegetables | 907 | 123.7 | +0.2 | –2.8 | +6.5 |
| Crop output (excluding fruits and vegetables) | 500 | 131.2 | +0.5 | –2.9 | +13.3 |
| Cereals | 190 | 143.2 | –0.4 | –7.9 | +10.6 |
| of which soft wheat | 113 | 144.5 | –0.5 | –6.5 | +14.3 |
| grain maize | 42 | 137.1 | +0.2 | –9.9 | +8.6 |
| Potatoes | 26 | 185.9 | /// | /// | +98.6 |
| Wines | 171 | 117.4 | +1.1 | +1.5 | +11.5 |
| Protected designation of origine | 134 | 115.6 | +1.1 | +1.6 | +10.5 |
| other wines | 36 | 124.2 | +1.1 | +1.2 | +15.2 |
| Oleaginous | 49 | 129.1 | +0.5 | –0.7 | +2.1 |
| Horticultural products | 31 | 109.0 | +3.0 | +4.5 | +7.3 |
| Other crop products | 34 | 115.3 | –1.4 | –1.5 | +7.6 |
| Fruits and vegetables (1) | 93 | 117.0 | /// | /// | +14.2 |
| Fresh vegetables | 51 | 110.0 | /// | /// | +2.3 |
| Fresh fruits | 34 | 128.3 | /// | /// | +39.9 |
| Animal output | 407 | 114.5 | –0.2 | –2.6 | –1.9 |
| Animals | 244 | 122.1 | +0.5 | –0.9 | +5.4 |
| of which large cattle | 96 | 123.2 | +0.9 | –2.2 | +4.8 |
| calves | 26 | 114.4 | +0.5 | +3.7 | +4.5 |
| pigs | 54 | 125.2 | +0.5 | –2.9 | +2.2 |
| sheep | 10 | 109.4 | +2.6 | +1.3 | 0.0 |
| poultry | 54 | 123.5 | –0.4 | +1.2 | +11.6 |
| of which chicken | 28 | 124.6 | –0.1 | +2.0 | +13.0 |
| Milk | 148 | 101.9 | 0.0 | –0.6 | –4.4 |
| of which cow milk (2) | 138 | 102.4 | 0.0 | –0.7 | –4.7 |
| Eggs | 15 | 114.5 | –13.4 | –33.4 | –50.1 |
- (1) Including vegetables for industry.
- (2) The price for March is not yet known and therefore is estimated by carrying forward the seasonally adjusted price from February
- Sources: INSEE - SSP (Ministry of Agriculture)
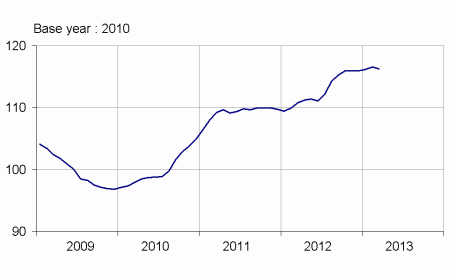
Purchase prices of the means of agricultural production almost stagnated in March.
Prices of intermediate consumptions dipped in March (–0.3 %) due mainly to the move of energy prices. Prices of investment were almost stable (+0.2 %). Prices for animals feed increased by almost 20 % over one year.
graphiquemeans – Purchase price of the means of agricultural production
tableauTab2 – Indices of purchase prices of the means of agricultural production (IPAMPA)
| weights | March 2013 | Variation as % over | |||
|---|---|---|---|---|---|
| a month | 3 month | a year | |||
| Total input | 1000 | 116.7 | –0.2 | +0.2 | +5.1 |
| Intermediate consumptions | 748 | 119.8 | –0.3 | +0.1 | +5.8 |
| Energy | 101 | 121.0 | –1.9 | +1.1 | –3.0 |
| Seeds | 66 | 108.1 | +0.6 | +1.8 | +4.7 |
| Fertilisers and soil improvers | 99 | 129.9 | +0.3 | +0.2 | +0.6 |
| Plant protection products | 83 | 100.4 | +0.6 | +0.4 | +0.8 |
| Animal feed | 209 | 137.6 | –0.7 | –1.3 | +17.6 |
| Veterinary expenses | 50 | 107.7 | 0.0 | +1.4 | +2.3 |
| Small equipment and tools | 16 | 107.5 | +0.4 | –0.6 | +2.8 |
| Maintenance of materials | 64 | 108.1 | +0.2 | +1.2 | +3.5 |
| Maintenance of buildings | 8 | 106.2 | 0.0 | 0.0 | +0.7 |
| Other goods and services | 52 | 105.4 | +0.1 | +0.5 | +1.7 |
| Goods and services contributing to investment | 252 | 105.4 | +0.2 | +0.5 | +2.5 |
| Material | 191 | 105.3 | +0.2 | +0.6 | +2.7 |
| Tractors | 81 | 106.0 | +0.3 | +0.7 | +2.8 |
| Machinery and plant for cultivation | 37 | 104.8 | 0.0 | +1.0 | +3.3 |
| Machinery and plant for harvesting | 43 | 105.5 | +0.2 | +0.2 | +3.1 |
| Utility vehicles | 19 | 102.3 | –0.3 | –0.6 | +0.2 |
| Buildings | 61 | 107.1 | 0.0 | 0.0 | 0.0 |
- (1) The repayment of the domestic tax on energy products (TICPE) benefiting farmers has been applied in advance for the year 2013
- Sources: INSEE - SSP (Ministry of Agriculture)
Documentation
Methodology (pdf,122 Ko)
Pour en savoir plus
Time series : Indices of agricultural prices
