


 12 December 2013
2013- n° 283The Consumer Prices Index remained steady in November 2013; it rose by 0.7%, year-on-year Consumer price index - final results - November 2013
12 December 2013
2013- n° 283The Consumer Prices Index remained steady in November 2013; it rose by 0.7%, year-on-year Consumer price index - final results - November 2013
The Consumer prices Index stayed steady in November 2013, after a decrease by 0.1% in October 2013. Seasonally adjusted, it was also unchanged in November 2013 compared with October 2013. In the year to November 2013 it grew by 0.7%, up from +0.6% in October 2013. Excluding tobacco, the CPI stabilised also in November 2013 and increased by 0.6% compared with the same month one year ago.
Monthly change: 0.0%; Year-on-year: +0.7%
The Consumer prices Index stayed steady in November 2013, after a decrease by 0.1% in October 2013. Seasonally adjusted, it was also unchanged in November 2013 compared with October 2013. In the year to November 2013 it grew by 0.7%, up from +0.6% in October 2013. Excluding tobacco, the CPI stabilised also in November 2013 and increased by 0.6% compared with the same month one year ago.
If the CPI stayed broadly stable in November 2013, the price indices of the different sectors moved in a different fashion: food prices and those of manufactured products increased slightly, prices of transport and communication services declined significantly while the price of energy, especially those of petroleum products, declined in November 2013.
Slight increase in food prices
After four consecutive months of decline, food prices rose slightly in November 2013 (+0.1% after —0.1% in October and —0.5% in September). Compared with the same month one year ago, they grew by 0.3% in November 2013 (after +0.2%, year–on–year in October 2013). After a slight decline in October (—0.1%), the prices of fresh foodstuff increased slightly in November 2013 (+0.1%): the rebound in the prices of fresh vegetables (+4.9% in November 2013 after —6.1% in October 2013; —2.7% year on year), had more than offset the decline, partly seasonal, in the prices of fresh fruits (—3.9%; —1.6% year-on-year). Excluding fresh products, food prices increased slightly in November (+0.1%) but slowed again, year–on–year. The CPI 12-month rate slipped from +0.6% in october to +0.5% in november 2013. Only the prices of alcoholic beverages remained dynamic in November 2013 (+0.2%; + 3.1% compared with the same month one year ago).
tableauOLE_LINK2 – Detailed figures for various groups
| Percentage change | ||||
|---|---|---|---|---|
| Items | Weight 2013 | Index Nov. 2013 | Month rate | Annual rate |
| a) All households - France | ||||
| All items (00 E) | 10000 | 127.21 | 0.0 | 0.7 |
| All items SA (00 C) | 10000 | 127.46 | 0.0 | 0.7 |
| Food (4000 E) | 1658 | 132.12 | 0.1 | 0.3 |
| Fresh food (4001 E) | 210 | 138.66 | 0.1 | –1.2 |
| Food excluding fresh products (4002 E) | 1448 | 131.18 | 0.1 | 0.5 |
| Tobacco (4034 E) | 206 | 249.81 | 0.0 | 3.5 |
| MANUFACTURED PRODUCTS (4003 E) | 2738 | 101.53 | 0.1 | –0.5 |
| Clothing and footwear (4004 E) | 458 | 111.53 | 0.1 | 0.8 |
| Medical products (4005 E) | 455 | 80.16 | –0.4 | –3.2 |
| Other manufactured products (4006 E) | 1825 | 104.49 | 0.3 | –0.1 |
| ENERGY (4007 E) | 822 | 177.10 | –0.6 | 0.1 |
| Petroleum products (4008 E) | 495 | 201.43 | –1.2 | –3.4 |
| SERVICES (4009 E) | 4576 | 133.68 | –0.1 | 1.5 |
| Actual rentals and services for dwellings (4010 E) | 748 | 140.82 | 0.0 | 1.5 |
| Medical services (4011 E) | 542 | 122.03 | 0.0 | 0.4 |
| Transport and communication services (4012 E) | 506 | 95.19 | –1.2 | 0.5 |
| Other services (4013 E) | 2780 | 143.26 | 0.0 | 1.9 |
| ALL ITEMS EXCLUDING RENTALS AND TOBACCO (5000 E) | 9202 | 124.75 | 0.0 | 0.6 |
| ALL ITEMS EXCLUDING TOBACCO (4018 E) | 9794 | 125.38 | 0.0 | 0.6 |
| b) Manual or clerical worker headed urban households - France | ||||
| ALL ITEMS EXCLUDING TOBACCO (4018 D) | 9704 | 125.18 | 0.0 | 0.6 |
| ALL ITEMS (00 D) | 10000 | 127.85 | –0.1 | 0.7 |
| c) Households that belong to the lowest equivalized disposable income quintile - France | ||||
| ALL ITEMS EXCLUDING TOBACCO (4018 Q) | 9674 | 126.47 | –0.1 | 0.6 |
- Source : Insee - Consumer Price Indexes
tableauTableau1English – Detailed figures for Core inflation* and HICP**
| Percentage change | ||||
|---|---|---|---|---|
| Items | Weight 2013 | Index Nov. 2013 | Month rate | Annual rate |
| All items "Core inflation" (4022 S) | 6085 | 122.51 | 0.1 | 0.8 |
| Food excluding fresh products, meat, milk and exotic products (4019 S) | 715 | 125.75 | 0.0 | –0.3 |
| Manufactured products (4020 S) | 2217 | 105.75 | 0.2 | 0.1 |
| Services including actual rentals and services for dwellings (4021 S) | 3153 | 138.34 | 0.0 | 1.6 |
| All items HICP (00 H) | 114.93 | 0.0 | 0.8 | |
- * ISJ : Core inflation indicator excludes public sector prices, the most volatile consumer prices and the tax measures. Base 100 in 1998, it is seasonally adjusted and is computed for all households in France mainland.
- **HICP : Harmonised Indices of Consumer Prices are inflation figures required under the Treaty on the functioning of the European Union. They are designed for international comparison of consumer price inflation between Member states of the Union. This index is calculated for all households in France (base 100 2005).
- Source : Insee - Consumer Price Indexes
graphiqueGraphique1English – Consumer price index (IPC) and Core inflation (ISJ) – year-on-year changes
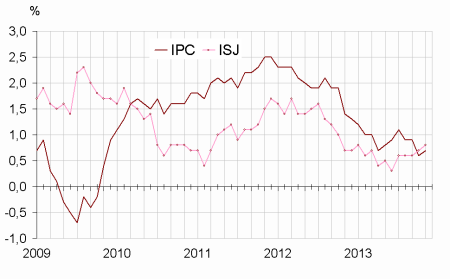
- Source : Insee - Consumer Price Indexes
Slight increase in the prices of manufactured products
Overall, the prices of manufactured goods increased by 0.1% in Novembre 2013 (—0.5% year–on–year), as in October 2013). The prices of clothing and footwear (+0.1%; +0.8% year–on–year) and those of the other manufactured goods (+0.3%; —0.1% year–on–year) also contributed to that increase. Particularly, the price of flowers and plants (+11.1%; +0.6% year–on–year) and those of household textiles (+1.4%; +3.7% year–on–year) grew seasonally in November 2013. On the opposite, the prices of games and toys seasonally fell by 2.1% in November 2013 (—3.8% in November 2013) and the price drop of audio-visual, photographic and information processing equipment has continued (—0.2%; –7.3% year–on–year). This fall of prices was especially strong for the photographic and cinematographic equipment and optical instruments (—2.1%; —16.2% year–on–year). Finally, prices of medical products continued to decline overall (—0.4% in November; —3.2% year on year).
Seasonal decline in prices of services
Seasonally, service prices decreased a little in November 2013 (—0.1%; —0.2% in November 2012; 1.5% year–on–year), mainly as a consequence of a fall of airfares (—7.2%; —3.3% year–on–year) and of prices of package holidays (—4.5%; +0.7% year–on–year). On the other hand, the rents of residence for holidays increased in November 2013 (+2.8%; +1.5% year–on–year). Moreover, prices of the health services and those of actual rentals and services for dwellings stabilised in November 2013. Finally, the telecommunication tariffs were almost unchanged in November 2013 but increased slightly compared with the same month one year ago (+0.5%), for the first time since April 2010.
The prices of petroleum products declined again
In November 2013, energy prices decreased by 0.6% compared with october 2013 and were 0.1% higher than those of the same month one year ago. This decline came mainly from a new drop in the prices of petroleum product (—1.2%; —3.4% year–on–year), on the same scale in November 2013 for heating fuels (—1.2%; —6.0% year-on-year) and for motor fuels (—1.3%; —3.0% year-on-year). In November 2013, the city gas prices went up by 0.6% (+1.4% year–on–year) while those of electricity were unchanged (+7.5% in a year to November 2013).
The core inflation indicator increased slightly
In November 2013, the core inflation indicator (ISJ) grew by 0.1% after a stability during the previous three months. Its annual rate of change was up to +0.8% In November 2013 after +0.7% in October 2013. The Harmonised Index of Consumer Prices (HICP) was almost stable in November 2013 and increased by 0.8 year–on–year (+0.7% in October 2013).
Pour en savoir plus
