


 27 March 2013
2013- n° 71In 2012 Q4 French GDP (–0.3%) and households’ purchasing power (–0.8%) decreased Quarterly national accounts - detailed figures - 4th Quarter 2012
27 March 2013
2013- n° 71In 2012 Q4 French GDP (–0.3%) and households’ purchasing power (–0.8%) decreased Quarterly national accounts - detailed figures - 4th Quarter 2012
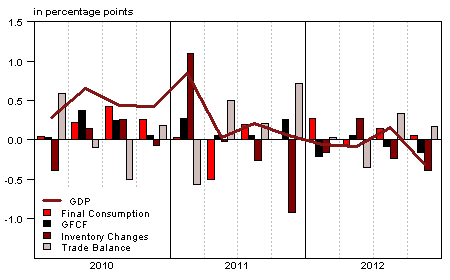
In 2012 Q4, French gross domestic product (GDP) in volume* stepped back (–0.3%), after +0.2% the previous quarter. Over the year, GDP growth was null in 2012, after +1.7% in 2011.
In 2012 Q4, French gross domestic product (GDP) in volume* stepped back (–0.3%), after +0.2% the previous quarter. Over the year, GDP growth was null in 2012, after +1.7% in 2011.
In 2012 Q4, total domestic demand (excluding inventory changes) weighed down on GDP growth: –0.1 point after +0.1 point. Indeed, households’ consumption expenditure remained sluggish (–0.1% after +0.1%) and gross fixed capital formation (GFCF) continued to decrease (–0.8% after –0.4%). Exports decreased in Q4 (–0.6% after +1.0%), but less strongly than imports whose decline increased (–1.2% after –0.2%): ultimately, foreign trade balance contributed again positively to GDP growth (+0.2 point after +0.3 point). On the contrary, changes in inventories continued to weigh down on GDP growth in Q4: –0.4 point, after –0.2 point the previous quarter.
Households’ purchasing power stepped back in Q4 (-0,8%) and over the year (-0.4%)
Households’ disposable income (HDI) decreased by 0.5% in Q4 (after +0.1% in Q3). Wages received by households slightly decelerated (+0.3% after +0.4%), and social benefits in cash remained dynamic (+0.9% after +1.0%). But these beneficial effects are overcompensated by the strong increase of taxes on income and wealth (+7.0% après +4.0%). This dynamic result in the second half is mainly due to measures passed in order to enhance the efficiency of the income tax in 2012, and to exceptional contribution for solidarity tax on wealth at year-end. Furthermore employees’ social contributions accelerated in Q4 (+2.0% after +0.7%) with the increase of contribution rate and the end of exemptions on overtime.
graphiqueGraph1 – GDP and its main components
tableauTab1 – GOODS AND SERVICES: SUPPLY AND USES CHAIN-LINKED VOLUMES
| 2012 Q1 | 2012 Q2 | 2012 Q3 | 2012 Q4 | 2011 | 2012 | |
|---|---|---|---|---|---|---|
| GDP | -0.1 | -0.1 | 0.2 | -0.3 | 1.7 | 0.0 |
| Imports | -0.1 | 1.6 | -0.2 | -1.2 | 5.2 | -0.3 |
| Households' consumption *expenditure | 0.2 | -0.3 | 0.1 | -0.1 | 0.2 | -0.1 |
| General government's *consumption expenditure | 0.6 | 0.5 | 0.4 | 0.3 | 0.2 | 1.4 |
| GFCF | -1.0 | 0.3 | -0.4 | -0.8 | 3.5 | 0.0 |
| *of which Non financial corporated and unincorporated enterprises | -1.6 | 0.4 | -0.6 | -0.8 | 5.1 | -0.5 |
| Households | -0.5 | -0.1 | -0.1 | -0.9 | 3.2 | 0.4 |
| General government | -0.7 | 0.6 | -0.2 | -0.8 | -1.8 | 0.2 |
| Exports | -0.1 | 0.4 | 1.0 | -0.6 | 5.5 | 2.5 |
| Contributions : | ||||||
| Internal demand excluding inventory changes | 0.1 | 0.0 | 0.1 | -0.1 | 0.9 | 0.3 |
| Inventory changes | -0.2 | 0.3 | -0.2 | -0.4 | 0.8 | -1.0 |
| Net foreign trade | 0.0 | -0.4 | 0.3 | 0.2 | 0.0 | 0.7 |
tableauTab2 – Sectoral accounts
| 2012 Q1 | 2012 Q2 | 2012 Q3 | 2012 Q4 | 2011 | 2012 | |
|---|---|---|---|---|---|---|
| Profit ratio of NFC* (level) | 27.7 | 27.9 | 28.2 | 27.7 | 28.5 | 27.9 |
| Household purchasing power | -0.3 | 0.4 | 0.0 | -0.8 | 0.5 | -0.4 |
- *NFC: non-financial corporations
tableauTab3 – GDP and components : prices indices
| 2012 Q1 | 2012 Q2 | 2012 Q3 | 2012 Q4 | 2011 | 2012 | |
|---|---|---|---|---|---|---|
| GDP | 0.3 | 0.6 | 0.4 | 0.4 | 1.3 | 1.6 |
| Imports | 1.2 | -0.6 | 0.2 | 0.4 | 5.4 | 1.8 |
| Cons. Exp. : | ||||||
| - Households | 0.6 | 0.2 | 0.1 | 0.3 | 2.1 | 1.7 |
| - GG* | 0.1 | 0.1 | 0.2 | 0.2 | 1.4 | 0.7 |
| Total GFCF | 0.7 | 0.5 | 0.1 | 0.3 | 2.9 | 2.1 |
| - of which Households | 0.8 | 0.9 | -0.4 | 0.4 | 3.8 | 2.7 |
| - of which NFE | 0.8 | 0.3 | 0.2 | 0.2 | 2.3 | 1.9 |
| - of which GG | 0.5 | 0.3 | 0.4 | 0.3 | 3.6 | 2.1 |
| Exports | 0.7 | -0.3 | 0.8 | 0.3 | 3.2 | 1.4 |
- *GG: General Government
tableauTab4 – Manufactured goods : supply and uses in volume
| 2012 Q1 | 2012 Q2 | 2012 Q3 | 2012 Q4 | 2011 | 2012 | |
|---|---|---|---|---|---|---|
| Industrie’s production | -1.4 | -1.0 | 0.9 | -2.3 | 3.2 | -2.3 |
| - of which value added | -1.1 | -0.7 | 0.6 | -1.9 | 0.7 | -2.5 |
| Imports | 0.6 | 2.4 | -1.2 | -1.7 | 6.7 | 0.1 |
| Intermediate uses | -0.5 | -0.5 | 0.5 | -1.3 | 2.9 | -0.8 |
| Cons. Exp. : | ||||||
| - of households | -0.4 | -0.7 | 0.6 | -0.1 | 0.9 | -0.7 |
| - of GG | 1.8 | 1.0 | 0.5 | 0.8 | 3.6 | 4.3 |
| Total GFCF | -3.6 | 0.0 | -0.9 | -1.6 | 7.3 | -2.9 |
| - of which NFC | -4.0 | 0.0 | -1.1 | -1.9 | 7.6 | -3.4 |
| - of which GG | 0.6 | 0.5 | 0.5 | 0.3 | -0.5 | 2.2 |
| Exports | 0.8 | 0.3 | 1.3 | -1.6 | 4.5 | 3.3 |
| Inventory changes (contribution) | -0.6 | 0.8 | -1.1 | -1.3 | 1.9 | -3.0 |
tableauTab5 – Households’ disposable income and ratios of households’ account
| 2012 Q1 | 2012 Q2 | 2012 Q3 | 2012 Q4 | 2011 | 2012 | |
|---|---|---|---|---|---|---|
| HDI | 0.4 | 0.5 | 0.1 | -0.5 | 2.6 | 1.3 |
| Household purchasing power | -0.3 | 0.4 | 0.0 | -0.8 | 0.5 | -0.4 |
| HDI by cu* (purchasing power) | -0.4 | 0.2 | -0.2 | -1.0 | -0.1 | -1.0 |
| Adjusted HDI (purchasing power) | -0.1 | 0.4 | 0.0 | -0.6 | 0.8 | 0.0 |
| Saving rate (level) | 15.7 | 16.3 | 16.2 | 15.6 | 16.2 | 16.0 |
| Financial saving rate (level) | 6.5 | 7.1 | 7.0 | 6.4 | 7.1 | 6.7 |
- *cu: consumption unit
tableauTab6 – Ratios of non-financial corporations’ account
| 2012 Q1 | 2012 Q2 | 2012 Q3 | 2012 Q4 | 2011 | 2012 | |
|---|---|---|---|---|---|---|
| Profit share | 27.7 | 27.9 | 28.2 | 27.7 | 28.5 | 27.9 |
| Investment ratio | 20.2 | 20.2 | 20.0 | 19.9 | 20.1 | 20.1 |
| Savings ratio | 12.9 | 13.4 | 13.6 | 12.4 | 13.5 | 13.1 |
| Self-financing ratio | 63.8 | 66.2 | 68.1 | 62.4 | 66.9 | 65.1 |
Consumption prices increased by 0.3% in Q4 (after +0.1% in the previous quarter), therefore households’ purchasing power stepped back by 0.8% in 2012 Q4 (after holding steady this summer). Over the year it also declined : –0.4% after +0.5% in 2011, the first decrease since 1984 (–1.1%). Taken individually (measured per consumption unit), it decreased by 1.0% (after –0.1% in 2011). The strong rise of income taxes over the year (+10.0% after +6.6% in 2011) is the main factor of this decrease.
In Q4 households’ consumption in value grew slightly (+0.2% as previous quarter). It was more dynamic than nominal income, reflecting the decline of savings ratio from 16.2% to 15.6% at year’s end, to stand at 16.0% on average over the whole year (after 16.2% in 2011).
Non financial corporation’s profit share decreased in Q4
In 2012 Q4, non financial corporation’s value added remained sluggish (–0.1% after +0.7%). Compensation of employees accelerated slightly (+0.4% after +0.3%): employers’ social contributions accelerated (with the increase of contribution rate and the end of exemptions on overtime), whereas wages slowed slightly. Moreover, taxes on production grew rapidly (+3.6% after +1.8%), due to the increase of “forfait social” rate, from 8% to 20% on August 1st. Overall, gross operating surplus stepped back and the NFC’s profit ratio decreased by 0.5 point to 27.7% at year-end. In 2012, the NFC’s profit ratio leveled down, at 27.9% after 28.5% in 2011, reaching its lowest level since 1985.
The GDP step back in Q4 2012 is confirmed
GDP growth’s estimation has not changed since the publication of the First Results (on February 14, 2013) and is still estimated at –0.3% in Q4 and 0.0% for the whole year. Nevertheless, some revisions cancel each other out: production in transportation is enhanced with the integration of the road haulage indicator; however the estimation of household consumption has been scaled down with the integration of new indicators.
Pour en savoir plus
