


 31 March 2014
2014- n° 74At the end of 2013, the Maastricht debt reached 1,925.3 billion euros Debt of the general government according to the Maastricht definition - 4th Quarter
2013
31 March 2014
2014- n° 74At the end of 2013, the Maastricht debt reached 1,925.3 billion euros Debt of the general government according to the Maastricht definition - 4th Quarter
2013
At the end of 2013, the Maastricht debt reached €1,925.3bn, a €13.4bn increase in comparison to Q3 2013. It accounted for 93.5 % of GDP, 0.3 point higher than Q3 2013’s level. The net public debt is more dynamic (+€29.9bn) and reached €1,768.7bn. It accounted for 85.9% of the GDP, +1.2 point compared to Q3 2013.

Warning: Quarterly debt figures are based on an accounting data source less exhaustive than the annual accounts. Results may therefore be updated during several quarters. Besides, data series from 1995 to now are updated following improvements on methodology and data sources.
Quarterly debt variations alone are not sufficient to forecast the deficit for the current year. To obtain the deficit from the change in Maastricht gross public debt, net acquisitions of financial assets and other accounts receivable and payable must also be taken into consideration.
The Maastricht debt increased by €13.4bn between the third quarter and the fourth quarter of 2013…
At the end of 2013, the Maastricht debt reached €1,925.3bn, a €13.4bn increase in comparison to Q3 2013. It accounted for 93.5 % of GDP, 0.3 point higher than Q3 2013’s level. The net public debt is more dynamic (+€29.9bn) and reached €1,768.7bn. It accounted for 85.9% of the GDP, +1.2 point compared to Q3 2013.
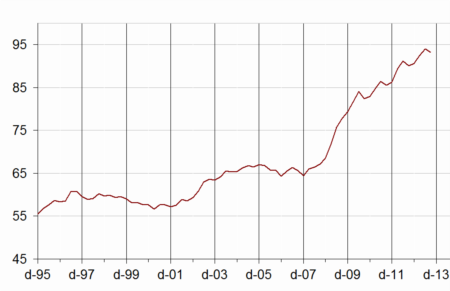
graphiqueGraphIR – General government debt under the Maastricht treaty (% of GDP) (*)
tableauTableauA – General government debt under the Maastricht treaty by sub-sector and by category
| 2012Q4 | 2013Q1 | 2013Q2 | 2013Q3 | 2013Q4 | |
|---|---|---|---|---|---|
| General Government | 1841,0 | 1881,4 | 1923,3 | 1911,9 | 1925,3 |
| %of GDP | 90,6% | 92,4% | 94,0% | 93,2% | 93,5% |
| of which, by sub-sector : | |||||
| State | 1444,3 | 1481,6 | 1523,4 | 1514,2 | 1523,2 |
| Central Agencies | 9,7 | 13,6 | 13,6 | 12,3 | 8,1 |
| Local Government | 176,1 | 172,8 | 172,0 | 172,2 | 182,3 |
| Social security funds | 210,9 | 213,3 | 214,2 | 213,2 | 211,7 |
| of which, by category | |||||
| Currency and deposits | 41,2 | 40,6 | 39,5 | 39,1 | 40,2 |
| Securities other than shares | 1547,1 | 1588,4 | 1628,6 | 1616,2 | 1618,7 |
| short-term | 192,4 | 203,5 | 202,4 | 210,3 | 199,5 |
| long-term | 1354,7 | 1384,9 | 1426,3 | 1405,9 | 1419,2 |
| Loans | 252,7 | 252,4 | 255,2 | 256,6 | 266,3 |
| short-term | 9,3 | 9,8 | 8,0 | 9,6 | 9,1 |
| long-term | 243,4 | 242,6 | 247,2 | 247,0 | 257,2 |
- Source : Insee, DGFiP, Banque de France
Pour en savoir plus
