


 31 October 2012
2012- n° 273Overall producer price of agricultural products increased in September Indices of agricultural prices - September 2012
31 October 2012
2012- n° 273Overall producer price of agricultural products increased in September Indices of agricultural prices - September 2012
Price of cereals stabilized at a high level (–0.5% over one month). The decrease in crop in the Black Sea region, as well as a lack of rain in Australia, kept the price of wheat up. Conversely, the crop of maize in the Northern hemisphere raised the available quantities, leading to a decrease in its price.
In September, overall producer price of agricultural products increased by 3.6 % compared to August ; year-over-year it rose by 10.7%
Price of cereals stabilized at a high level (–0.5% over one month). The decrease in crop in the Black Sea region, as well as a lack of rain in Australia, kept the price of wheat up. Conversely, the crop of maize in the Northern hemisphere raised the available quantities, leading to a decrease in its price.
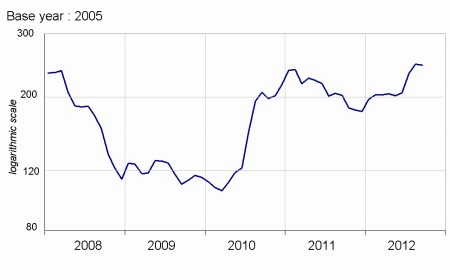
graphiquecereal – Producer price of cereals
Price of oleaginous also remained firm (+0.1 %), due to a high demand for feed oil.
Price of potatoes went up strongly year-over-year (+81.3 %). The new crop was less considerable than last year in North-Western Europe.
Price of wine rose in September (+1.1 %), due to quality wine (+1.9 %).
The producers of seeds, as well as those of tree nursery, raised their annual prices in September.
Price of fresh fruits increased year-over-year (+16.2 %) in September. Peach and plum became more expensive : the quantities put on sale for these were more in line with the demand than last year. The prices of apple and pear noticeably rose as a result of a sharp decrease in production for these two fruits in Europe.
graphiquevegetable – Producer price of fresh vegetables
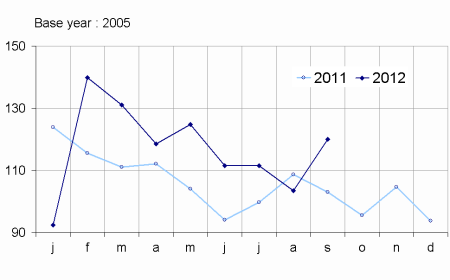
Price of fresh vegetables rose year-over-year (+16.4 %). Prices of tomato, salad and onion went up due to a decreasing production this season and to a moderate foreign competition for tomato. On the other hand melon did not sell well.
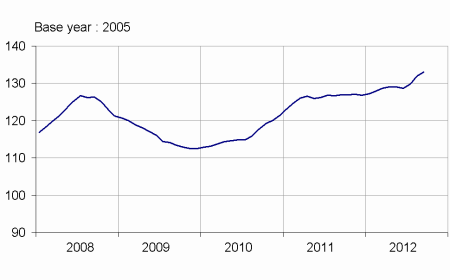
graphiquepig – Producer price of pigs and large cattle

On a seasonally adjusted basis, price of animals went up in September (+2.8 %). Price of pigs kept up rising (+10.8%), reflecting a dropping national supply : the lack of profitability in this sector has led to a progressive decline in production for several months. Price of poultry partly reflected the increase in price of chicken feed.
tableauTab1 – Indices of producer prices of agricultural products (IPPAP)
| Variation as % over: | |||||
|---|---|---|---|---|---|
| weights | September 2012 | a month | 3 months | a year | |
| raw | seasonally adjusted data | raw | |||
| Agricultural goods output | 1000 | 143.0 | +3.6 | +7.9 | +10.7 |
| excluding fruits and vegetables | 878 | 145.7 | +2.9 | +8.5 | +10.3 |
| Crop output (excluding fruits and vegetables) | 417 | 164.9 | +3.7 | +14.0 | +14.4 |
| Cereals | 115 | 244.0 | –0.5 | +20.8 | +22.7 |
| of which soft wheat | 63 | 260.6 | –0.1 | +21.2 | +30.3 |
| grain maize | 27 | 219.9 | –2.3 | +22.1 | +18.2 |
| Potatoes | 19 | 218.0 | /// | /// | +81.3 |
| Wines | 161 | 122.4 | +1.1 | +0.7 | +2.0 |
| quality wines | 140 | 122.7 | +1.9 | +1.9 | +3.5 |
| other wines | 21 | 120.4 | –3.7 | –6.5 | –7.2 |
| Oleaginous | 28 | 235.3 | +0.1 | +8.8 | +19.1 |
| Horticultural products | 51 | 103.6 | +2.1 | +2.9 | –1.0 |
| Other crop products | 43 | 115.1 | +5.0 | +9.1 | +3.9 |
| Fruits and vegetables (1) | 122 | 122.9 | /// | /// | +14.4 |
| Fresh vegetables | 61 | 120.0 | /// | /// | +16.4 |
| Fresh fruits | 39 | 135.3 | /// | /// | +16.2 |
| Animal output | 461 | 128.4 | +1.9 | +2.5 | +5.9 |
| Animals | 286 | 131.2 | +2.8 | +7.6 | +14.0 |
| of which large cattle | 108 | 126.0 | –0.4 | +3.4 | +16.3 |
| calves | 29 | 117.6 | –0.3 | –0.6 | –0.7 |
| pigs | 64 | 139.2 | +10.8 | +22.2 | +31.1 |
| sheep | 14 | 121.8 | +2.0 | +7.7 | +6.2 |
| poultry | 59 | 145.9 | +3.0 | +6.9 | +6.7 |
| of which chicken | 26 | 145.7 | +3.0 | +7.6 | +7.0 |
| Milk | 159 | 116.9 | 0.0 | –6.5 | –8.5 |
| of which cow milk (2) | 148 | 117.3 | 0.0 | –7.0 | –9.0 |
| Eggs | 13 | 208.2 | +2.0 | –1.5 | +18.8 |
- (1) Including vegetables for industry.
- (2) The price for September is not yet known and therefore is estimated by carrying forward the seasonally adjusted price of August.
- Sources: INSEE - SSP (ministry of agriculture)
Purchase price of the means of agricultural production increased in September
The price of intermediate consumptions rose over one month (+1.2 %) mainly as a result of higher prices for animal feeding stuffs. Year-over-year, it went up by 4.7 %, due to those same products and energy too. On the other hand, price of investment slightly decreased (–0.3%).
graphiquemeans – Purchase price of the means of agricultural production
tableauTab2 – Indices of purchase prices of the means of agricultural production (IPAMPA)
| weights | September 2012 | Variation as % over | |||
|---|---|---|---|---|---|
| a month | |||||
| Total input | 1000 | 133.0 | +0.9 | +3.4 | +4.7 |
| Goods and services currently consumed in agriculture | 758 | 137.2 | +1.2 | +4.4 | +5.9 |
| Energy (1) | 84 | 155.7 | 0.0 | +9.6 | +9.7 |
| Seeds | 51 | 117.7 | +0.9 | +0.5 | +2.2 |
| Fertilisers and soil improvers | 92 | 167.0 | +0.5 | +1.5 | +2.3 |
| Plant protection products | 77 | 106.7 | –0.3 | 0.0 | +0.1 |
| Animal feeding stuffs | 189 | 159.9 | +4.3 | +10.9 | +14.2 |
| Veterinary expenses | 38 | 118.2 | +0.2 | +0.4 | +2.8 |
| Small equipment and tools | 14 | 111.9 | –0.3 | 0.0 | –0.5 |
| Maintenance of materials | 56 | 130.4 | 0.0 | +0.7 | +3.6 |
| Maintenance of buildings | 9 | 124.0 | 0.0 | –0.2 | +1.9 |
| Other goods and services | 149 | 112.5 | –0.8 | –0.4 | +0.3 |
| Goods and services contributing to investment | 242 | 120.0 | –0.3 | 0.0 | +1.2 |
| Material | 170 | 117.2 | –0.3 | +0.2 | +1.3 |
| Tractors | 71 | 114.0 | –0.3 | +0.2 | +1.0 |
| Machinery and plant for cultivation | 36 | 119.7 | 0.0 | +0.2 | +1.3 |
| Machinery and plant for harvesting | 37 | 116.6 | –1.9 | –0.6 | +0.5 |
| Utility vehicles | 16 | 113.6 | –0.2 | –0.4 | +1.5 |
| Buildings | 72 | 126.7 | –0.2 | –0.5 | +0.9 |
- (1) The repayment of 5 cents per litre of fuel of the domestic tax on energetical products (TICPE) benefiting farmers has been applied in advance for the year 2012
- Sources : Insee - SSP (ministry of agriculture)
Documentation
Methodology (pdf,122 Ko)
Pour en savoir plus
Time series : Indices of agricultural prices
