


 20 February 2014
2014- n° 38The Consumer Prices Index decreased by 0.6% in January 2014; it rose by 0.7%, year-on-year Consumer price index - final results - January 2014
20 February 2014
2014- n° 38The Consumer Prices Index decreased by 0.6% in January 2014; it rose by 0.7%, year-on-year Consumer price index - final results - January 2014
The Consumer Prices Index (CPI) decreased by 0.6% in January 2014, after a decline by 0.3% in December 2013. Year-on-year, it grew by 0.7% in January 2014 as in December 2013. Excluding tobacco, the CPI decreased also by 0.6% in January 2014 and, seasonally adjusted, it stabilized. The largest downward pressures on the change in the CPI of January 2014 came mainly from winter sales which explained the fall of manufactured product prices. This year, the effect of winter sales is slightly increased by a calendar of price collections fully located during that period. Moreover, as every year in January, some seasonal decreases in prices of services linked with tourism have also contributed to that downturn. The growth of tobacco prices (+2.1%; +5.6% year-on-year), increases in VAT rates and the usual revaluations of some service tariffs in January did not offset those temporary declines in CPI.
Monthly change: -0.6%; Year-on-year: +0.7%
The Consumer Prices Index (CPI) decreased by 0.6% in January 2014, after a decline by 0.3% in December 2013. Year-on-year, it grew by 0.7% in January 2014 as in December 2013. Excluding tobacco, the CPI decreased also by 0.6% in January 2014 and, seasonally adjusted, it stabilized. The largest downward pressures on the change in the CPI of January 2014 came mainly from winter sales which explained the fall of manufactured product prices. This year, the effect of winter sales is slightly increased by a calendar of price collections fully located during that period. Moreover, as every year in January, some seasonal decreases in prices of services linked with tourism have also contributed to that downturn. The growth of tobacco prices (+2.1%; +5.6% year-on-year), increases in VAT rates and the usual revaluations of some service tariffs in January did not offset those temporary declines in CPI.
Manufactured good prices decreased in January with winter sales
In January 2014, the manufactured product prices went down by 3.0% (-1.2% year-on-year) due to the winter sales. The clothing and footwear prices fell by 15.4% in January 2014 and by 4.0%, year-on-year. This was also the same for major appliance prices which declined by 2.2% in January 2014 (-1.7% in January 2013), for those of furniture and furnishings which went down by 2.4% (-2.1% in January 2013; +0.7% year-on-year) and for those of household textiles which fell by 5.8% (-5.7% in January 2013; +0.5% year-on-year). Moreover, the downward pressures in the prices of the technological devices continued (-1.5% and -7.7% year-on-year for the Audio-visual equipment and related products; -2.7% and -14.4% for telephone equipment). Finally, the new scales of ecological malus contributed to increase the new car prices in January (+2.5%; +2.9% year-on-year).
tableauOLE_LINK2 – Detailed figures for various groups
| Percentage change | ||||
|---|---|---|---|---|
| Items | Weight 2014 | Index Jan. 2014 | Month rate | Annual rate |
| a) All households - France | ||||
| All items (00 E) | 10000 | 126.93 | -0.6 | 0.7 |
| All items SA (00 C) | 10000 | 127.66 | 0.0 | 0.6 |
| Food (4000 E) | 1653 | 132.14 | -0.1 | 0.4 |
| Fresh food (4001 E) | 210 | 138.83 | -1.3 | 0.1 |
| Food excluding fresh products (4002 E) | 1443 | 131.18 | 0.1 | 0.4 |
| Tobacco (4034 E) | 204 | 255.15 | 2.1 | 5.6 |
| MANUFACTURED PRODUCTS (4003 E) | 2653 | 98.59 | –3.0 | -1.2 |
| Clothing and footwear (4004 E) | 438 | 94.90 | -15.4 | –4.0 |
| Medical products (4005 E) | 434 | 79.62 | -0.5 | -2.7 |
| Other manufactured products (4006 E) | 1781 | 103.98 | -0.5 | -0.4 |
| ENERGY (4007 E) | 850 | 179.91 | 0.8 | 0.1 |
| Petroleum products (4008 E) | 475 | 203.72 | -0.2 | -3.1 |
| SERVICES (4009 E) | 4640 | 134.77 | 0.3 | 1.7 |
| Actual rentals and services for dwellings (4010 E) | 748 | 141.52 | 0.3 | 1.7 |
| Medical services (4011 E) | 552 | 121.91 | -0.2 | 0.2 |
| Transport and communication services (4012 E) | 503 | 95.52 | -1.9 | 0.6 |
| Other services (4013 E) | 2837 | 144.91 | 0.7 | 2.2 |
| ALL ITEMS EXCLUDING RENTALS AND TOBACCO (5000 E) | 9202 | 124.38 | -0.7 | 0.5 |
| ALL ITEMS EXCLUDING TOBACCO (4018 E) | 9796 | 125.04 | -0.6 | 0.5 |
| b) Manual or clerical worker headed urban households - France | ||||
| ALL ITEMS EXCLUDING TOBACCO (4018 D) | 9707 | 124.87 | -0.6 | 0.6 |
| ALL ITEMS (00 D) | 10000 | 127.63 | -0.5 | 0.7 |
| c) Households that belong to the lowest equivalized disposable income quintile - France | ||||
| ALL ITEMS EXCLUDING TOBACCO (4018 Q) | 9679 | 126.18 | -0.7 | 0.6 |
- Source : Insee - Consumer Price Indexes
tableauTableau1English – Detailed figures for Core inflation* and HICP**
| Percentage change | ||||
|---|---|---|---|---|
| Items | Weight 2014 | Index Jan. 2014 | Month rate | Annual rate |
| All items "Core inflation" (4022 S) | 6053 | 122.06 | -0.4 | 0.1 |
| Food excluding fresh products, meat, milk and exotic products (4019 S) | 713 | 126.06 | 0.3 | -0.1 |
| Manufactured products (4020 S) | 2162 | 103.88 | -1.6 | -1.3 |
| Services including actual rentals and services for dwellings (4021 S) | 3178 | 138.6 | 0.0 | 1.1 |
| All items HICP (00 H) | 114.63 | -0.6 | 0.8 | |
- * ISJ : Core inflation indicator excludes public sector prices, the most volatile consumer prices and the tax measures. Seasonally adjusted, this index is calculated for all households in France excluding overseas departments and territories (base 100 1998).
- **HICP : Harmonised Indices of Consumer Prices are inflation figures required for international comparison between Member states of the Union. This index is calculated for all households in France (base 100 2005).
- Source : Insee - Consumer Price Indexes
graphiqueGraphique1English – Consumer price index (IPC) and Core inflation (ISJ) – year-on-year changes
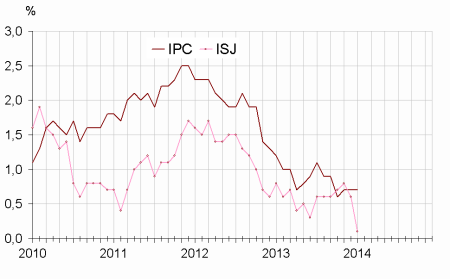
- Source : Insee - Consumer Price Indexes
Service prices increased in January
Overall, prices of services increased by 0.3% in January 2014 (+1.7% year-on-year and after +1.4% in December 2013 compared with the same month one year ago), mainly due to the changes in VAT rates. Thus, in January 2014, the prices of maintenance and repair services for the dwellings rose by 2.0% (+3.3% year-on-year), those of the transport equipment by 1.4% (+3.1% year-on-year), those of the restaurants and cafes by 1.1% (+3.0% year-on-year) and those of the recreational and cultural services by 0.6% (+2.0% year-on-year). Moreover, as every year in January,
some tariffs were revaluated. In particular, the tarifs of water supply increased by 2.5% (+3.9% year-on-year), those of the dwelling insurances by 2.1% (+3.2% year-on-year), those of the health insurances by 3.7% (+3.0% year-on-year) and those of the financial services by +1.4% (+2.5% year-on–year). The tariffs of passenger transport by road rose by also in January 2014 (+1.7%; +3.4% year-on-year) as those of combined passenger transports (+2.2%; +2.7% year-on-year). One the contrary, after the end-of-year holidays, air fares fell in January 2014 by 10.4% (-1.7% year on year), as those of accommodation services (-2.3%; +1.1% year-on-year) and those of package holidays (-16.5%; stable year-on-year). Finally, the tariffs of the transport insurances declined in January 2013 (-2.5%; -4.2% compared with the same month one year ago) due to promotions.
Energy prices increased
In January 2013, energy prices grew by 0.8% (+0.1% year-on-year) due to the increase in electricity (+2.8%; +7.5% year-on-year) and, in a lesser extent, in city gas prices (+0.8% :+0.3% year-on-year) while the petroleum product prices declined slightly (-0.2%; -3.1% year-on-year).
Slight decrease in food prices
Food prices declined in January 2014 by 0.1% (+0.4% year-on-year). Fresh foodstuff prices decreased usually in January (-1.3%; -1.0% in January 2013, +0.1% year-on-year), fresh fruit prices by 4.6% (as in January 2013, -1.9% year-on-year), whereas fresh vegetable prices remained almost stable (+0.1% ; +1.0% year-on-year). Excluding fresh foodstuffs, the food prices increased slightly in January 2014 (+0.1%; +0.4% year-on-year) but only alcoholic beverage prices were dynamic (+0.8%; +2.7% year-on-year) mainly due to excise duty increases and other taxes.
Fall of the core inflation indicator
The core inflation indicator excludes new tax measures. In january 2014, it was corrected from the increases in VAT rates which took place that month while they were probably not totally taken account in most prices especially for the manufactured products. Thus, in January 2014, the core inflation indicator (ISJ) was down 0.4. It rose by 0.1%, year-on-year, in January 2014. The Harmonized Index of Consumer Prices (HICP) went down by 0.6% in January 2013 (+0.8% year-on-year as in December 2013).
Pour en savoir plus
