


 23 October 2013
2013- n° 243In October 2013, the business climate is pausing in the retail trade and in the
trade and repair of motor vehicles Monthly survey of retailing - October 2013
23 October 2013
2013- n° 243In October 2013, the business climate is pausing in the retail trade and in the
trade and repair of motor vehicles Monthly survey of retailing - October 2013
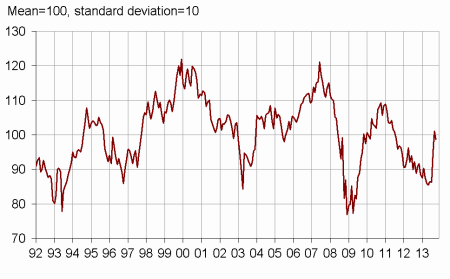
According to the managers, the business climate is pausing in October 2013 in the retail trade and in the trade and repair of motor vehicles: the composite indicator stabilized after the strong increase of the two last months, and is remaining near its long terme average.
According to the managers, the business climate is pausing in October 2013 in the retail trade and in the trade and repair of motor vehicles: the composite indicator stabilized after the strong increase of the two last months, and is remaining near its long terme average.
graphiquegraph_indsynt_en – Business climate synthetic indicator
Past and previous activity under their average
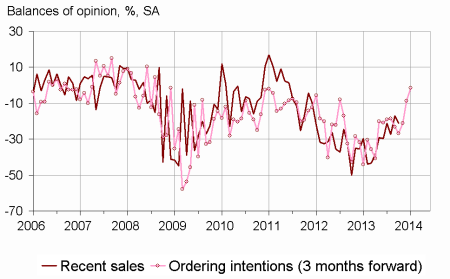
According to the business leaders, the past activity kept on reducing over the last few months, the corresponding balance remaining slightly under its average. About forecasts, the balances concerning expected sales and ordering intentions declined, going under their mean level again. The general business outlook remained near their long term average.
The level of stocks was considered higher, but was still significantly under the standard level.
The balance concerning expected prices remained near its average.
graphiqueGraph_ventes_ic_en – Recent sales and ordering intentions

tableautab1_en – Global data
| Ave. (1) | July 13 | Aug. 13 | Sept. 13 | Oct. 13 | |
|---|---|---|---|---|---|
| Business climate | 100 | 86 | 95 | 101 | 99 |
| General business outlook | –30 | –48 | –36 | –31 | –29 |
| Recent sales | –7 | –26 | –18 | –13 | –13 |
| Expected sales | –3 | –18 | –10 | –3 | –10 |
| Ordering intentions | –9 | –23 | –14 | –6 | –12 |
| Stocks | 11 | 13 | 7 | 5 | 9 |
| Past selling prices (2) | –6 | –9 | –7 | ||
| Expected selling prices | –3 | –2 | –4 | –1 | –4 |
| Cash position (2) | –15 | –27 | –23 | ||
| Workforce size: recent trend | 0 | –10 | –7 | –10 | –7 |
| Workforce size: future trend | –2 | –12 | –9 | –6 | –6 |
- (1) Average since 1991 (2004 for recent and expected sales and ordering intentions).
- (2) Bi-monthly question (odd-numbered months).
- Source: monthly survey in the retail trade and in the trade and repair of motor vehicles - INSEE
A little less unfavourable employment
According to the business managers, employment slightly slowed down over the last few months, and should stabilize over the next few months.
Retail trade
Decline of expected activity
Less trade retailers than in September declared a decrease in their past activity. In non-specialized trade, the corresponding balance is going over its average, but in specialized trade, it is still low.
Retailers forecasts were pessimistic again: each of the two balances concerning expected sales and ordering intentions declined, becoming significantly under its mean level.
Stocks were declared heavier, going back to their standard level.
The expected prices balance remained near its long term average.
Trade and repair of motor vehicles
graphiquegraph_ventes_ic_auto_en – Recent sales and ordering intentions in motor vehicles
Optimistic forecasts
As many vehicle traders than over the last month declared a fall in their past activity, but they were more optimistic concerning their previous activity: expected sales and ordering intentions balances kept on progressing, being now over their averages.
The level of stocks was considered slighter again, getting very low under its standard level.
Less managers than in September declared a fall in prices over the next few months.
tableautab2_en – Detailed data
| Moy. (1) | July 13 | Aug. 13 | Sept. 13 | Oct. 13 | |
|---|---|---|---|---|---|
| Retail trade - Global data | |||||
| Recent sales | –4 | –28 | –14 | –11 | –9 |
| Expected sales | 0 | –17 | –6 | –3 | –12 |
| Ordering intentions | –7 | –23 | –11 | –4 | –16 |
| Stocks | 10 | 16 | 5 | 2 | 11 |
| Past selling prices (2) | –8 | –7 | –7 | ||
| Expected selling prices | –4 | –2 | –4 | –1 | –4 |
| Cash position (2) | –13 | –26 | –21 | ||
| Workforce size: recent trend | 1 | –6 | –4 | –6 | –3 |
| Workforce size: future trend | –1 | –11 | –7 | –4 | –5 |
| Non-specialized retail trade | |||||
| Recent sales | –1 | –24 | –5 | –1 | 1 |
| Expected sales | 6 | –6 | 6 | 7 | 0 |
| Ordering intentions | 2 | –16 | –3 | 11 | –4 |
| Stocks | 7 | 19 | 4 | 4 | 10 |
| Past selling prices (2) | –7 | –1 | –3 | ||
| Expected selling prices | –4 | 4 | –8 | 2 | 3 |
| Cash position (2) | –7 | –13 | –6 | ||
| Specialized retail trade | |||||
| Recent sales | –9 | –34 | –25 | –22 | –21 |
| Expected sales | –6 | –33 | –19 | –12 | –21 |
| Ordering intentions | –17 | –32 | –19 | –23 | –21 |
| Stocks | 14 | 13 | 7 | 1 | 12 |
| Past selling prices (2) | –7 | –15 | –12 | ||
| Expected selling prices | –4 | –9 | 1 | –4 | –12 |
| Cash position (2) | –22 | –40 | –38 | ||
| Trade and repair of motor cars and motorcycles | |||||
| Recent sales | –11 | –21 | –27 | –17 | –21 |
| Expected sales | –9 | –20 | –21 | –4 | –2 |
| Ordering intentions | –14 | –27 | –21 | –9 | –2 |
| Stocks | 16 | 7 | 12 | 10 | 7 |
| Past selling prices (2) | 1 | –13 | –6 | ||
| Expected selling prices | 5 | –1 | –3 | –1 | 0 |
| Cash position (2) | –26 | –31 | –28 | ||
| Workforce size: recent trend | –9 | –21 | –17 | –19 | –22 |
| Workforce size: future trend | –7 | –20 | –15 | –14 | –12 |
- (1) Average since 1991 (2003 for trade and repair of motor vehicles and 2004 for recent and expected sales and ordering intentions).
- (2) Bi-monthly question (odd-numbered months).
- Source: monthly survey in the retail trade and in the trade and repair of motor vehicles - INSEE
Documentation
Methodology (pdf,129 Ko)
Pour en savoir plus
