


 10 January 2013
2013- n° 6The Consumer Prices Index increased by 0.3% in December 2012; it rose by 1.3% year-on-year Consumer price index - final results - December 2012
10 January 2013
2013- n° 6The Consumer Prices Index increased by 0.3% in December 2012; it rose by 1.3% year-on-year Consumer price index - final results - December 2012
Here are published monthly and year-on-year changes of the Consumer Prices Index (CPI) in December 2012. Annual average changes of the CPI will be published on 17th January. Annual averages and year-on-year changes are different: annual averages refer to the whole set of prices observed during one year compared to those observed during the previous year. The year-on-year price changes refer to the prices observed during a particular month compared to those observed during the same month previous year.
Here are published monthly and year-on-year changes of the Consumer Prices Index (CPI) in December 2012. Annual average changes of the CPI will be published on 17th January. Annual averages and year-on-year changes are different: annual averages refer to the whole set of prices observed during one year compared to those observed during the previous year. The year-on-year price changes refer to the prices observed during a particular month compared to those observed during the same month previous year.
Monthly change: +0.3% ; Year-on-year: +1.3%
In December 2012, the Consumer Price index (CPI) grew by 0.3%, after a decline by 0.2% in November. Year-on-year, the CPI rose by 1.3% (+1.4% in November). Excluding tobacco, the CPI went up also by 0.3% in December (+1.2% compared to December 2011). Seasonally adjusted, rise of the CPI reached 0.1% in December (+1.3 % year-on-year). The largest upward pressures on the change in the CPI of December came mainly from seasonally price hikes in services and manufactured products.
Rises in service prices for seasonal reasons
Prices in certain service prices jumped in December 2012, owing to holidays at the year ending. The main components with the highest monthly rates in December were air fares (+12.5%), package travel prices (+17.0%; +1.3% year-on-year) and holiday villages and holiday centers prices (+8.4%). As usual in December, refuse collection fees increased (+2.8%; +3.3% in December 2011). Besides, this year, communication prices recovered a little in December (+1.8%; —13.3% year-on-year) due to more favorable new mobile rates. Service charges for insurance grew also significantly after promotion endings (+2.0%; +3.3% year-on-year). Overall, service prices rose by 0.7% in December 2012 (+1.3% year-on-year; +0.5% in December 2011).
tableauOLE_LINK2 – Detailed figures for various groups
| Percentage change | ||||
|---|---|---|---|---|
| Items | weight 2012 | Index Dec. 2012 | Month rate | Annual rate |
| a) All households - France | ||||
| All items (00 E) | 10000 | 126,76 | 0,3 | 1,3 |
| All items SA (00 C) | 10000 | 126,74 | 0,1 | 1,3 |
| Food (4000 E) | 1638 | 131,73 | 0,0 | 2,3 |
| Fresh food (4001 E) | 205 | 140,12 | –0,1 | 7,7 |
| Food excluding fresh products (4002 E) | 1433 | 130,53 | 0,0 | 1,5 |
| Tobacco (4034 E) | 198 | 241,37 | 0,0 | 6,9 |
| MANUFACTURED PRODUCTS (4003 E) | 2987 | 102,22 | 0,2 | 0,2 |
| Clothing and footwear (4004 E) | 466 | 111,42 | 0,7 | 1,2 |
| Medical products (4005 E) | 460 | 82,58 | –0,3 | –3,1 |
| Other manufactured products (4006 E) | 2061 | 104,80 | 0,2 | 0,7 |
| ENERGY (4007 E) | 868 | 176,55 | –0,2 | 2,6 |
| Petroleum products (4008 E) | 518 | 207,73 | –0,3 | 1,0 |
| SERVICES (4009 E) | 4309 | 132,55 | 0,7 | 1,3 |
| Actual rentals and services for dwellings (4010 E) | 737 | 139,03 | 0,2 | 2,1 |
| Medical services (4011 E) | 529 | 121,75 | 0,1 | 1,3 |
| Transport and communication services (4012 E) | 523 | 97,55 | 3,0 | –5,2 |
| Other services (4013 E) | 2520 | 141,21 | 0,5 | 2,3 |
| ALL ITEMS EXCLUDING RENTALS AND TOBACCO (5000 E) | 9217 | 124,47 | 0,3 | 1,2 |
| ALL ITEMS EXCLUDING TOBACCO (4018 E) | 9802 | 125,02 | 0,3 | 1,2 |
| b) manual or clerical worker headed urban households- France | ||||
| ALL ITEMS EXCLUDING TOBACCO (4018 D) | 9716 | 124,83 | 0,3 | 1,2 |
| ALL ITEMS (00 D) | 10000 | 127,37 | 0,3 | 1,4 |
- Source : Insee - Consumer Price Indexes
tableauTableau1 – Detailed figures for Core inflation* and HICP**
| Percentage change | ||||
|---|---|---|---|---|
| Items | weight 2012 | Index Dec. 2012 | Month rate | Annual rate |
| All items "Core inflation" (4022 S) | 6096 | 121,85 | 0,2 | 0,7 |
| Food excuding fresh products, meat, milk and exotic products (4019 S) | 701 | 126,24 | –0,1 | 0,6 |
| Manufactured products (4020 S) | 2472 | 105,68 | 0,0 | 0,7 |
| Services including actual rentals and services for dwellings (4021 S) | 2923 | 136,82 | 0,5 | 0,7 |
| All items HICP (00 H) | 114,41 | 0,4 | 1,5 | |
- * ISJ : Core inflation indicator excludes public sector prices, the most volatile consumer prices and the tax measures. This index is seasonally adjusted. This index is calculated for all households in France excluding overseas departments and territories (base 100 1998).
- **HICP : Harmonised Indices of Consumer Prices are inflation figures required under the Treaty on the functioning of the European Union. They are designed for international comparison of consumer price inflation between Member states of the Union. This index is calculated for all households in France (base 100 2005).
- Source : Insee - Consumer Price Indexes
graphiqueGraphique1English – Consumer price index (IPC) and Core inflation (ISJ) – year-on-year changes
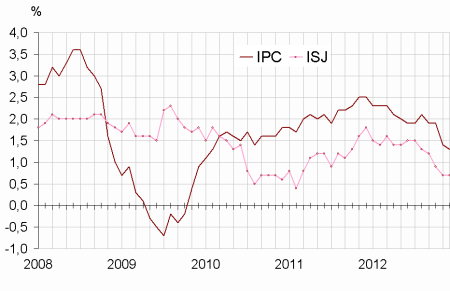
- Source : Insee - indice des prix à la consommation
Rise in manufactured product prices
In December 2012, prices of manufactured products went up by 0.2% (+0.2% year-on-year). Clothing and footwear prices were up for seasonal reasons in December (+0.7%, like in December 2011; +1.2% year-on-year). The same went for Household textiles (+4.7% in December 2012; +3.6% in December 2011) and for Furniture and furnishings, carpets and other floor coverings (+0.4%; +0.5% year-on-year). On the opposite, downward pressures came from the pursuit of price declines in medical products (—0.3%; —3.1% year-on-year), in information processing equipment (—1.0%; —6.6% year-on-year), in Equipment for the reception, recording and reproduction of sound and pictures (—0.9%; —10.1% year-on-year), in photographic and cinematographic equipment (—2.2%; —13.7% year-on-year) and in Telephone and telefax equipment (—0.9%; —8.2% year-on-year). Besides, prices of new car increased in December (+1.0%; +2.0% year-on year) after promotion endings.
Food prices stabilized
Food prices were steady in December 2012 (+2.3% year-on-year). Prices of fresh food products decreased again slightly in December (—0.1% after —1.1% In November). Year-on year, they increased by 7.7% in December. Fruit prices went down for seasonal reasons in December (—1.4%; +8.2% year-on-year) while fresh vegetable prices went up (+0.5%; +11.2% year-on-year). Despite large hikes in raw food prices from the beginning of 2012, other food prices (excluding fresh products) remained globally steady in December (+1.5% year-on-year). Hikes, in particular in meat prices (+0.4%; +3.1% year-on-year) Raisings in meat prices were offset in December by downturns in alcoholic beverage prices (—0.4%; +3.4% year-on-year), in non-alcoholic beverage prices (—0.2%; +1.2% year-on-year) and in bread and cereal prices (—0.1%; +1.0% year-on-year).
Energy prices slipped again in December
In December 2012, energy prices decreased again (—0.2%; +2.6% year-on-year) as a consequence of a new drop in petroleum product prices (—0.3%; +1.0% year-on-year). This new decline is more marked for heat fuel prices (—1.1%; +3.1% over one year) than for fuels for transport (—0.2%; +0.4% year-on-year). Gas and electricity prices were stable in December but they grew respectively by 8.2% and 3.2% year-on-year.
Core inflation stable in November over a year
Core inflation indicator (ISJ) rose by 0.2% in December 2012 (+0.7% year-on-year, unchanged from November 2012). The harmonized Index of Consumer Prices (HICP) increased by 0.4% (+1.5% year-on-year after +1.6% in November).
Pour en savoir plus
