


 14 November 2013
2013- n° 260In Q3 2013 GDP was slightly down (–0.1% after +0.5%) Quarterly national accounts - second estimate - 3rd Quarter 2013
14 November 2013
2013- n° 260In Q3 2013 GDP was slightly down (–0.1% after +0.5%) Quarterly national accounts - second estimate - 3rd Quarter 2013
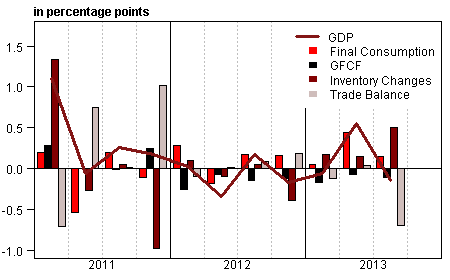
In Q3 2013, GDP in volume terms* was slightly down (–0.1%), after a rebound in Q2 (+0.5%).
In Q3 2013, GDP in volume terms* was slightly down (–0.1%), after a rebound in Q2 (+0.5%).
Household consumption expenditure decelerated (+0.2% after +0.4%). Furthermore, total gross fixed capital formation (GFCF) decreased again (–0.6% after –0.4%). Overall, final domestic demand (excluding inventory changes) decelerated and had a neutral contribution to GDP after +0.4 point the previous quarter. Exports relapsed (–1.5% after +1.9%) whereas imports remained on a rising trend (+1.0%) after a dynamic second quarter (+1.6%). Hence, the foreign trade balance had a negative accounting contribution to GDP growth: –0.7 point, after a neutral contribution the previous quarter. Conversely, changes in inventories contributed for +0.5 point to GDP growth (after +0.1 point).
Total production relapsed
After a dynamic second quarter (+0.9%), production of goods and services stepped back in Q3 (–0.3%). Production in manufactured goods decreased by 1.0% (after +2.0%) : activity declined in all industries, except transport equipment industry which slowed significantly. Activity was still depressed in construction (–0.5% after –0.6%). Output in tradable services weakened slighly after a rebound in Q2 (–0.1% after +0.7%), in particular in business services. Finally, output in non tradable services improved (+0.2% after +0.7%).
Household consumption decelerated
Household consumption expenditure slowed down in Q3 (+0.2% after +0.4%). In particular, global energy expenses dropped in Q3 (–3.0%) after two dynamic quarters (+2.0% and +2.5%), due to temperatures below their seasonal norms. However, expenditure on food products upturned close to their trend (+0.4% after –1.1%).
graphiqueGraph1 – GDP and its main components
tableauTab1 – Goods and services: supply and uses, chain-linked volumes
| 2012 Q4 | 2013 Q1 | 2013 Q2 | 2013 Q3 | 2012 | 2013 (ovhg) | |
|---|---|---|---|---|---|---|
| GDP | -0.2 | -0.1 | 0.5 | -0.1 | 0.0 | 0.1 |
| Imports | -1.1 | 0.1 | 1.6 | 1.0 | -0.9 | 0.9 |
| Households' consumption *expenditure | 0.1 | -0.1 | 0.4 | 0.2 | -0.4 | 0.3 |
| General government's *consumption expenditure | 0.4 | 0.4 | 0.7 | 0.2 | 1.4 | 1.6 |
| GFCF | -0.6 | -0.8 | -0.4 | -0.6 | -1.2 | -2.3 |
| *of which Non financial corporated and unincorporated enterprises | -0.5 | -0.8 | 0.1 | -0.6 | -1.9 | -2.0 |
| Households | -1.0 | -1.3 | -1.7 | -0.6 | -0.4 | -3.7 |
| General government | -0.7 | -0.5 | 0.3 | -0.2 | -0.6 | -1.2 |
| Exports | -0.6 | -0.4 | 1.9 | -1.5 | 2.5 | 0.1 |
| Contributions : | ||||||
| Internal demand excluding inventory changes | 0.0 | -0.1 | 0.4 | 0.0 | -0.1 | 0.2 |
| Inventory changes | -0.4 | 0.2 | 0.1 | 0.5 | -0.8 | 0.2 |
| Net foreign trade | 0.2 | -0.1 | 0.0 | -0.7 | 1.0 | -0.3 |
tableauTab2 – Sectoral accounts
| 2012 Q4 | 2013 Q1 | 2013 Q2 | 2013 Q3 | 2012 | 2013 (ovhg) | |
|---|---|---|---|---|---|---|
| Profit ratio of NFC* (level) | 28.0 | 28.1 | 28.2 | 28.3 | ||
| Household purchasing power | -0.9 | 0.9 | 0.5 | -0.9 | 0.6 |
- *NFC: non-financial corporations
tableauTab3 – GDP and components: prices indices
| 2012 Q4 | 2013 Q1 | 2013 Q2 | 2013 Q3 | 2012 | 2013 (ovhg) | |
|---|---|---|---|---|---|---|
| GDP | 0.2 | 0.5 | 0.2 | 0.2 | 1.5 | 1.1 |
| Imports | 0.1 | -0.6 | -0.9 | 0.2 | 1.9 | -0.9 |
| Cons. Exp. : | ||||||
| - Households | 0.2 | 0.3 | -0.1 | 0.2 | 1.9 | 0.6 |
| - GG* | 0.2 | 0.1 | 0.0 | 0.2 | 1.1 | 0.5 |
| Total GFCF | 0.1 | 0.4 | -0.1 | 0.2 | 1.7 | 0.6 |
| - of which Households | -0.1 | 0.3 | -0.3 | 0.1 | 2.3 | 0.1 |
| - of which NFE | 0.1 | 0.6 | 0.0 | 0.2 | 1.3 | 0.9 |
| - of which GG | 0.2 | 0.2 | -0.1 | 0.3 | 2.2 | 0.7 |
| Exports | 0.2 | -0.3 | -0.4 | -0.1 | 1.2 | -0.1 |
- *GG: General Government
tableauTab4 – Manufactured goods: supply and uses in volume
| 2012 Q4 | 2013 Q1 | 2013 Q2 | 2013 Q3 | 2012 | 2013 (ovhg) | |
|---|---|---|---|---|---|---|
| Industrie’s production | -2.0 | 0.5 | 2.0 | -1.0 | -2.8 | 0.3 |
| - of which value added | -1.6 | 0.0 | 1.2 | -0.8 | -2.0 | -0.6 |
| Imports | -1.4 | 0.0 | 1.6 | 1.6 | 0.3 | 0.6 |
| Intermediate uses | -1.1 | 0.1 | 1.5 | -0.4 | -1.8 | 0.2 |
| Cons. Exp. : | ||||||
| - of households | 0.0 | -0.9 | 0.4 | 0.4 | -1.2 | -0.5 |
| - of GG | 1.5 | 1.7 | 1.5 | 0.4 | 4.3 | 4.5 |
| Total GFCF | -0.9 | -1.0 | -0.3 | 0.9 | -3.0 | -2.3 |
| - of which NFC | -1.1 | -1.1 | -0.4 | 0.9 | -3.7 | -2.8 |
| - of which GG | -0.1 | 0.0 | 0.2 | 0.2 | 1.0 | -0.1 |
| Exports | -1.3 | -0.6 | 2.8 | -1.9 | 3.0 | -0.1 |
| Inventory changes (contribution) | -1.0 | 1.1 | 0.2 | 0.9 | -2.5 | 0.9 |
tableauTab5 – Households’ disposable income and ratios of households’ account
| 2012 Q4 | 2013 Q1 | 2013 Q2 | 2013 Q3 | 2012 | 2013 (ovhg) | |
|---|---|---|---|---|---|---|
| HDI | -0.7 | 1.2 | 0.4 | 0.9 | 1.1 | |
| Household purchasing power | -0.9 | 0.9 | 0.5 | -0.9 | 0.6 | |
| HDI by cu* (purchasing power) | -1.0 | 0.8 | 0.3 | -1.5 | 0.1 | |
| Adjusted HDI (purchasing power) | -0.6 | 0.8 | 0.5 | -0.4 | 0.7 | |
| Saving rate (level) | 15.0 | 15.9 | 15.9 | 15.6 | ||
| Financial saving rate (level) | 5.6 | 6.6 | 6.9 | 6.2 |
- *cu: consumption unit
tableauTab6 – Ratios of non-financial corporations’ account
| 2012 Q4 | 2013 Q1 | 2013 Q2 | 2013 Q3 | 2012 | |
|---|---|---|---|---|---|
| Profit share | 28.0 | 28.1 | 28.2 | 28.3 | |
| Investment ratio | 19.2 | 19.1 | 19.0 | 19.4 | |
| Savings ratio | 11.9 | 12.4 | 12.8 | 12.8 | |
| Self-financing ratio | 62.2 | 65.0 | 67.6 | 65.9 |
Besides, car purchases slowed down but still increased (+1.2% after +2.1%) after falling by –5.5% in Q1. Finally, expenditure in services slowed anew (+0.2% after +0.4%).
Investment weakened again
In the summer, total GFCF stepped back for the seventh consecutive quarter (–0.6% after –0.4%). GFCF in construction declined again (–0.5% after –0.8%). Moreover, investments on services declined more sharply (–1.0% after –0.4%), notably in business services and in information and communication. In contrast, GFCF in manufactured goods renewed with growth (+0.9% after –0.3%). By institutional sectors, expenditures dropped again in non-financial corporations (-0.6% after +0.1%) and in general government (-0.2% after +0.3%); the decline of household GFCF speed down (–0.6% after –1.7%).
Exports were still depressed, imports were still up
In Q3, exports stepped back (–1.5% after +1.9%) ; almost all goods are concerned by the fall. The decline was particularly sharp for refined products and transport equipment. At the same time, imports kept on increasing (+1.0% after +1.6%), accelerating especially for transport equipment and refined products. Overall, foreign trade weighed down GDP evolution : –0.7 point after having a neutral accounting contribution the previous quarter.
Changes in inventories contributed positively to GDP evolution
Changes in inventories had a significantly positive contribution to GDP evolution this quarter : +0.5 point, after already +0.1 point the previous quarter. Much of this contribution is imputable to transport equipment (+0.3 point). For these products, changes in inventory compensated partially the effects of the foreign trade (–0.4 point).
Revisions
GDP growth in 2013 Q2 is still estimated at +0.5%. Revisions are of limited size and are mainly imputable to revisions of indicators (especially industrial production index) and to updates of seasonal adjustments.
Pour en savoir plus
Time series : Operations on goods and services
Time series : Gross domestic product balance
Time series : Institutional sector accounts
Time series : Branch accounts
