


 28 June 2013
2013- n° 149At the end of Q1 2013, the Maastricht debt reached 1 870.3 billion euros Debt of the general government according to the Maastricht definition - 1st Quarter
2013
28 June 2013
2013- n° 149At the end of Q1 2013, the Maastricht debt reached 1 870.3 billion euros Debt of the general government according to the Maastricht definition - 1st Quarter
2013
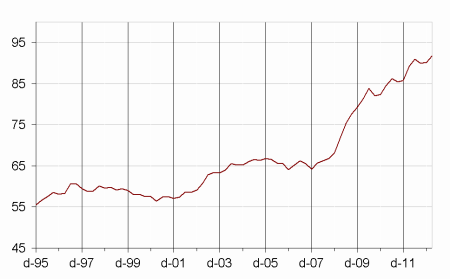
At the end of Q1 2013, the Maastricht debt, which is a gross debt, reached €1870.3bn, a €36.5bn rise in comparison to Q4 2012. As a percentage of GDP, it peaked at 91.7 %, 1.5 point higher than Q4 2012. The net public debt was up by €21.9bn.
The Maastricht debt increased by €36.5bn between the fourth quarter of 2012 and the first quarter of 2013
At the end of Q1 2013, the Maastricht debt, which is a gross debt, reached €1870.3bn, a €36.5bn rise in comparison to Q4 2012. As a percentage of GDP, it peaked at 91.7 %, 1.5 point higher than Q4 2012. The net public debt was up by €21.9bn.
…as a result of the growth of the State’s debt
The State’s contribution to the debt went up by €37.4bn in the first quarter. The growth is driven by negotiable debt : the State issued €30.4bn of bonds and €6.4bn of short-term bills. The State borrowed €1.2bn in favour of the EFSF. Conversely, the Trésor deposit liabilites went down by €0.7bn.
Social security funds contribution to debt rose by €2.4bn. On the one hand, Acoss and Unedic respectively borrowed €4.3bn and €1.0bn. On the other hand, Cnaf and Cades respectively got out of €1.9bn and €1.1bn debt.
…whereas the local government reduced its debt
Local government units contribution to debt decreased by €3.3bn : they paid back €5.5bn of long-term loans and borrowed €2.1bn€ of short-term loans.
The contribution to debt of central agencies (Other central government units) remained steady.
graphiqueGraphIR – General government debt under the Maastricht treaty (% of GDP) (*)
tableauTableauA – General government debt under the Maastricht treaty by sub-sector and by category
| 2012Q1 | 2012Q2 | 2012Q3 | 2012Q4 | 2013Q1 | |
|---|---|---|---|---|---|
| General Government | 1789,2 | 1832,4 | 1818,0 | 1833,8 | 1870,3 |
| %of GDP | 89,0% | 90,8% | 89,7% | 90,2% | 91,7% |
| of which, by sub-sector : | |||||
| State | 1383,8 | 1435,1 | 1421,2 | 1439,9 | 1477,2 |
| Central Agencies | 10,0 | 9,7 | 9,8 | 9,9 | 9,9 |
| Local Government | 161,2 | 161,6 | 162,1 | 173,7 | 170,5 |
| Social security funds | 234,2 | 226,0 | 224,9 | 210,3 | 212,7 |
| of which, by category | |||||
| Currency and deposits | 31,5 | 30,8 | 32,3 | 37,7 | 37,0 |
| Securities other than shares | 1540,5 | 1571,6 | 1556,5 | 1546,1 | 1587,4 |
| short-term | 236,2 | 225,7 | 214,1 | 191,6 | 202,7 |
| long-term | 1304,2 | 1345,9 | 1342,4 | 1354,4 | 1384,6 |
| Loans | 217,2 | 230,0 | 229,1 | 250,0 | 245,9 |
| short-term | 9,7 | 11,4 | 8,7 | 8,1 | 8,6 |
| long-term | 207,6 | 218,6 | 220,4 | 242,0 | 237,3 |
- (*) Explanations in the box "For more details"
- Source : National Accounts 2005 basis - Insee, DGFiP, Banque de France
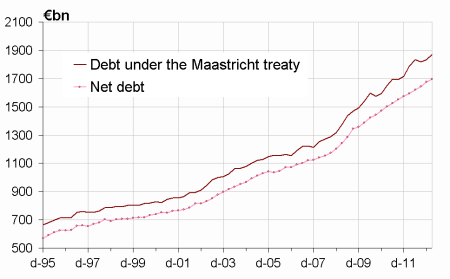
The public net debt rises less rapidly than Maastricht gross debt
At the end of Q1 2013, the net public debt reached €1 697.1bn (equivalent to 83.3 % of GDP as opposed to 82.4 % in the previous quarter), a €21.9bn increase compared to the previous quarter. The €14.6bn gap between changes in net and gross debt is explained by the rise of State’s treasury (+€13.8bn). Among the other noteworthy changes, the State granted €1.2bn of long-term loans to Euro zone countries, within the framework of EFSF.
tableauTableauB – General government net debt by sub-sector
| 2012Q1 | 2012Q2 | 2012Q3 | 2012Q4 | 2013Q1 | |
|---|---|---|---|---|---|
| General government | 1593,2 | 1619,0 | 1642,9 | 1675,1 | 1697,1 |
| of which : | |||||
| The State | 1289,6 | 1314,5 | 1330,9 | 1348,1 | 1371,0 |
| Central Agencies | –2,6 | –3,0 | –3,3 | –2,9 | –3,3 |
| Local government | 151,6 | 151,9 | 152,3 | 163,9 | 160,9 |
| Social security funds | 154,7 | 155,5 | 163,0 | 166,1 | 168,4 |
graphiqueGraph_dette_nette – Debt and net debt
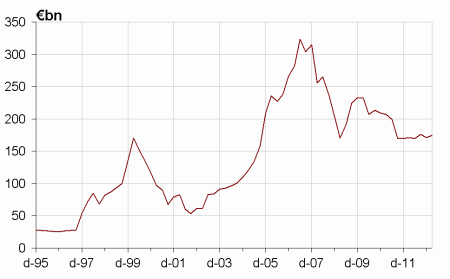
The value of quoted shares and mutual fund shares slightly increased
At the end of Q1 2013, the value of quoted shares and mutual fund shares held by general government units reached €174.3 bn, a €4.2 bn rise compared to Q4 2012. The amount of quoted shares went up by €3.3bn thanks to the appreciation of shares held by State and Central agencies (+€2.1bn and +€0.5bn). The value of mutual fund shares slightly increased by €0.9bn compared to the previous quarter : Unedic bought €1.4bn whereas RSI and FRR sold respectively for €0.4bn and €0.3bn.
tableauTableauC – General government holdings of quoted shares and mutual fund shares
| 2012Q1 | 2012Q2 | 2012Q3 | 2012Q4 | 2013Q1 | |
|---|---|---|---|---|---|
| General government | 171,8 | 170,3 | 176,8 | 170,1 | 174,3 |
| of which : | |||||
| The State | 56,1 | 55,6 | 52,7 | 47,9 | 50,0 |
| Central Agencies | 24,2 | 23,4 | 24,5 | 26,1 | 26,5 |
| Local government | 0,6 | 0,6 | 0,7 | 0,6 | 0,6 |
| Social security funds | 90,8 | 90,6 | 99,0 | 95,5 | 97,2 |
graphiqueGraph_F5 – General government holdings of quoted shares and mutual fund shares
Pour en savoir plus
