


 30 June 2014
2014- n° 152At the end of Q1 2014, the Maastricht debt accounted for 93.6 % of GDP Debt of the general government according to the Maastricht definition - 1st Quarter
2014
30 June 2014
2014- n° 152At the end of Q1 2014, the Maastricht debt accounted for 93.6 % of GDP Debt of the general government according to the Maastricht definition - 1st Quarter
2014
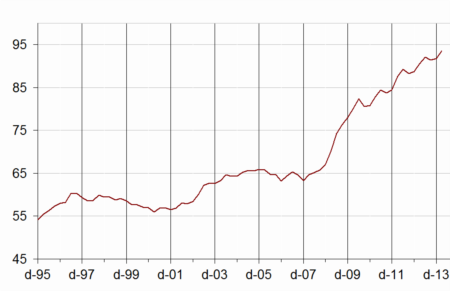
At the end of Q1 2014, the Maastricht debt reached €1,985.9bn, a €45.5bn increase in comparison to Q4 2013. It accounted for 93.6 % of GDP, 1.8 point higher than Q4 2013’s level. The net public debt growth is less dynamic (+€17.2bn).
- The Maastricht debt increased by €45.5bn compared to the previous quarter…
- … as a result of the rise in the State debt
- … whereas local government and central agencies debt went down
- The net public debt increased less rapidly than the gross public debt
- The value of quoted shares and mutual fund shares increased

Warning: Quarterly debt figures are based on an accounting data source less exhaustive than the annual accounts. Results may therefore be updated during several quarters.
Quarterly debt variations alone are not sufficient to forecast the deficit for the current year. To obtain the deficit from the change in Maastricht gross public debt, net acquisitions of financial assets and other accounts receivable and payable must also be taken into consideration.
The Maastricht debt increased by €45.5bn compared to the previous quarter…
At the end of Q1 2014, the Maastricht debt reached €1,985.9bn, a €45.5bn increase in comparison to Q4 2013. It accounted for 93.6 % of GDP, 1.8 point higher than Q4 2013’s level. The net public debt growth is less dynamic (+€17.2bn).
… as a result of the rise in the State debt
The State contribution to the debt rose by €43.3bn in the first quarter. The increase was driven by long-term negotiable debt (+€32.3bn) and short term negotiable debt (+€12.1bn). The Trésor deposit liabilities slightly decreased (-€1.1bn).
Social security funds contribution to debt went up by €4.6bn: Cades got into €4.5bn of debt in relation to the €5.0bn of debt assumption from the General social security system. The last one reduced its debt by €0.6bn and the Hospitals by €0.5bn. By contrast, Unedic issued €1.1bn of securities.
… whereas local government and central agencies debt went down
Local government contribution to debt diminished by €2.1bn: they paid back €6.0bn of long-term loans but borrowed €3.9bn in short-term loans. In detail, the departments and the municipalities respectively reduced their debt by €1.6bn and €1.1bn whereas the regions debt grew by €0.8bn.
The contribution of central agencies (central government units other than the State) remains steady (-€0.2bn).
graphiqueGraphIR – General government debt under the Maastricht treaty (% of GDP) (*)
tableauTableauA – General government debt under the Maastricht treaty by sub-sector and by category
| 2013Q1 | 2013Q2 | 2013Q3 | 2013Q4 | 2014Q1 | |
|---|---|---|---|---|---|
| General Government | 1,895.8 | 1,937.7 | 1,926.3 | 1,940.4 | 1,985.9 |
| %of GDP | 90.5% | 92.1% | 91.4% | 91.8% | 93.6% |
| of which, by sub-sector: | |||||
| State | 1,492.1 | 1,533.9 | 1,524.7 | 1,534.0 | 1,577.3 |
| Central Agencies | 17.5 | 17.5 | 16.2 | 12.4 | 12.2 |
| Local Government | 172.8 | 172.0 | 172.2 | 182.3 | 180.2 |
| Social security funds | 213.3 | 214.2 | 213.2 | 211.7 | 216.3 |
| of which, by category | |||||
| Currency and deposits | 40.6 | 39.5 | 39.1 | 40.3 | 39.2 |
| Securities other than shares | 1,592.3 | 1,632.5 | 1,620.1 | 1,623.0 | 1,676.6 |
| short-term | 203.8 | 202.7 | 210.6 | 199.9 | 214.1 |
| long-term | 1,388.5 | 1,429.8 | 1,409.5 | 1,423.1 | 1,462.4 |
| Loans | 262.9 | 265.7 | 267.1 | 277.1 | 270.2 |
| short-term | 9.8 | 8.0 | 9.6 | 9.1 | 11.1 |
| long-term | 253.2 | 257.8 | 257.5 | 268.0 | 259.1 |
- (*) Explanations in the box "For more details"
- Source : National Accounts 2010 basis - Insee, DGFiP, Banque de France
The net public debt increased less rapidly than the gross public debt
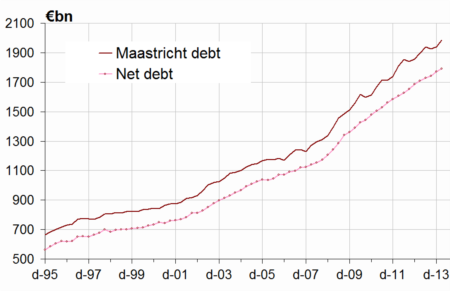
At the end of Q1 2014, the net public debt reached €1,790.2bn (equivalent to 84.4 % of GDP as opposed to 83.9 % in the previous quarter), a €17.2bn increase compared to the previous quarter. The €28.3bn gap between changes in net and gross debt is explained by the strong dynamism of the State’s treasury (+€25.8bn). The social security funds treasury also went up by €1.3bn and they bought €0.9bn of securities.
tableauTableauB – General government net debt by sub-sector
| 2013Q1 | 2013Q2 | 2013Q3 | 2013Q4 | 2014Q1 | |
|---|---|---|---|---|---|
| General government | 1,709.8 | 1,727.3 | 1,742.7 | 1,773.0 | 1,790.2 |
| of which : | |||||
| The State | 1,375.3 | 1,396.0 | 1,414.8 | 1,431.9 | 1,449.9 |
| Central Agencies | 9.1 | 8.9 | 7.5 | 4.4 | 3.8 |
| Local government | 160.7 | 159.8 | 159.9 | 170.0 | 167.5 |
| Social security funds | 164.7 | 162.6 | 160.4 | 166.7 | 169.0 |
graphiqueGraph_dette_nette – Maastricht gross debt and net debt
The value of quoted shares and mutual fund shares increased
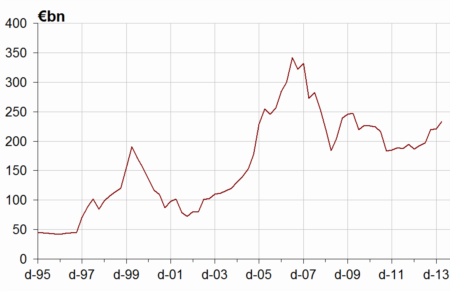
At the end of Q1 2014, the value of quoted shares and mutual fund shares held by general government units reached €233.2bn, a €12.3bn rise compared to Q4 2013. The value of quoted shares went up by €10.5bn due to the appreciation of shares held by State (+€9.4bn). The value of mutual fund shares grew by €1.8bn this quarter, related to the purchase of €0.8bn of money market funds by Unedic and the rise of stock markets.
tableauTableauC – General government holdings of quoted shares and mutual fund shares
| 2013Q1 | 2013Q2 | 2013Q3 | 2013Q4 | 2014Q1 | |
|---|---|---|---|---|---|
| General government | 192.1 | 197.4 | 218.9 | 220.9 | 233.2 |
| of which : | |||||
| The State | 51.2 | 56.2 | 70.0 | 71.9 | 81.3 |
| Central Agencies | 24.5 | 24.7 | 27.4 | 28.2 | 29.4 |
| Local government | 0.3 | 0.3 | 0.3 | 0.3 | 0.3 |
| Social security funds | 116.1 | 116.2 | 121.2 | 120.6 | 122.2 |
graphiqueGraph_F5 – General government holdings of quoted shares and mutual fund shares
Remark: The European Financial Stability Facility (EFSF), settled on June 7th 2010, borrows on financial market to lend to Eurozone countries in turmoil (Greece, Portugal, Ireland). Its bonds issuances are guaranteed by the other Member States, including France. Following Eurostat’s decision of January 27th 2011, all the operations of the EFSF are reincorporated into the public accounts of the guarantor States, proportionally to their commitments. This treatment leaves their net debts unchanged. During Q1 2014, no additional lending was recorded.
Pour en savoir plus
