


 27 June 2014
2014- n° 149In May 2014, household consumption of goods recovered (+1.0% after -0.2%) Household consumption expenditure on goods - May 2014
27 June 2014
2014- n° 149In May 2014, household consumption of goods recovered (+1.0% after -0.2%) Household consumption expenditure on goods - May 2014
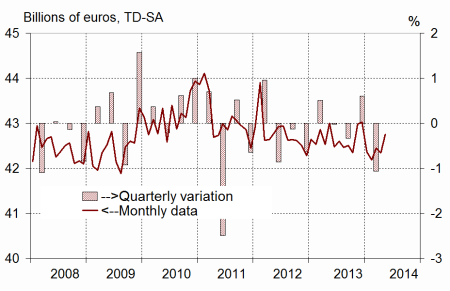
In May, household consumption expenditure on goods increased by 1.0% in volume*, after a 0.2% decrease in April. This increase resulted mainly from the upturn in expenditure on energy products.
In May, household consumption expenditure on goods increased by 1.0% in volume*, after a 0.2% decrease in April. This increase resulted mainly from the upturn in expenditure on energy products.
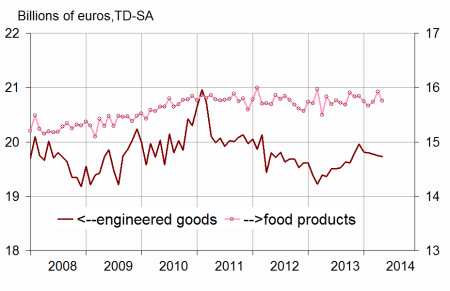
Engineered goods : almost stable
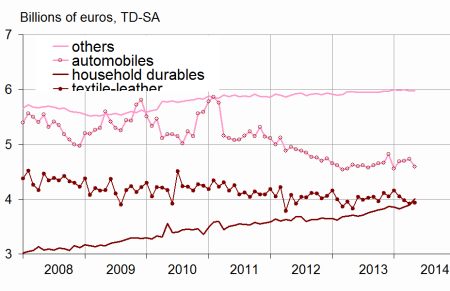
Durables: decreasing
Household expenditure on durable goods decreased slightly in May (-0.4% after +0.7%), a decrease mainly attributable to the decline in car purchases (-2.9% after +0.7% in April). However, purchases of household durables speeded up (+3.1% after +0.7%), notably in consumer electronics.
Textile-leather: increasing
Household consumption of textile, clothing and leather increased anew (+1.6%), after three consecutive months of decrease.
Other engineered goods: stabilization
In May, consumption expenditure on other engineered goods were almost stable (+0.1%) after a drop in April ( -0.4%), especially in expenditure on hardware.
* Volumes are chained and all figures are trading days and seasonally adjusted.
graphiquegraph1_new_ang – Total consumption of goods
graphiquegraph2_new_ang – Food and engineered goods
graphiquegraph3_new_ang – Breakdown of engineered goods
Food products: decreasing anew
Consumption of food products decreased in May (-1.1%), after two months of rise (+0.4% in March and +1.2% in April).
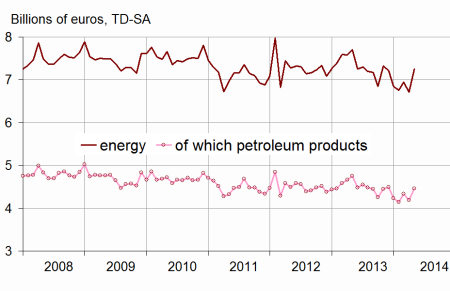
Energy: marked upturn
In May, household consumption of energy products bounced distinctly (+8.0%) after a downturn in April (-3.3%) and in Q1. With a return to average temperatures in May, expenditure for heating purposes increased, whereas they had dropped at the beginning of the year thanks to mild temperatures during winter and the beginning of spring.
The downward trend in April is scaled up by 0.1 points
Household consumption expenditure on goods is now estimated at -0.2% in April, instead of -0.3% estimated for the previous publication.
This revision resulted mainly from the reestimation of seasonal adjustment models, as well as from the integration of new information on the indicators commonly used, notably in equipment goods.
tableautab1_eng – Household consumption expenditure on goods
| March | April | May | May2014/ | |
|---|---|---|---|---|
| 2014 | 2014 | 2014 | May2013 | |
| Food products | 15.733 | 15.920 | 15.751 | |
| Change (%) | 0.4 | 1.2 | –1.1 | –0.5 |
| Engineered goods | 19.773 | 19.744 | 19.731 | |
| Change (%) | –0.1 | –0.1 | –0.1 | 1.9 |
| Durables | 9.796 | 9.860 | 9.817 | |
| Change (%) | 0.3 | 0.7 | –0.4 | 2.5 |
| Of which Automobiles | 4.697 | 4.728 | 4.592 | |
| Change (%) | 0.3 | 0.7 | –2.9 | –0.8 |
| Of which Household durables | 3.861 | 3.888 | 4.009 | |
| Change (%) | 1.0 | 0.7 | 3.1 | 8.3 |
| Textile-leather | 3.982 | 3.917 | 3.940 | |
| Change (%) | –1.7 | –1.6 | 0.6 | 2.9 |
| Other engineered goods | 5.997 | 5.972 | 5.979 | |
| Change (%) | 0.2 | –0.4 | 0.1 | 0.3 |
| Energy | 6.946 | 6.716 | 7.253 | |
| Change (%) | 2.8 | –3.3 | 8.0 | –5.9 |
| Including petroleum products | 4.332 | 4.192 | 4.461 | |
| Change (%) | 4.6 | –3.2 | 6.4 | –6.2 |
| Total | 42.436 | 42.341 | 42.755 | |
| Change (%) | 0.6 | –0.2 | 1.0 | –0.6 |
| Manufactured goods | 36.430 | 36.456 | 36.301 | |
| Change (%) | 0.7 | 0.1 | –0.4 | –0.3 |
graphiquegraph4_new_ang – Energy
Documentation
Methodology (pdf,23 Ko)
Pour en savoir plus
