


 30 August 2013
2013- n° 198Overall producer prices of agricultural products decreased in July Indices of agricultural prices - July 2013
30 August 2013
2013- n° 198Overall producer prices of agricultural products decreased in July Indices of agricultural prices - July 2013
In July 2013, overall producer prices of agricultural products decreased by 1.0 % ; over one year they rose by 2.9 %.
In July 2013, overall producer prices of agricultural products decreased by 1.0 % ; over one year they rose by 2.9 %.
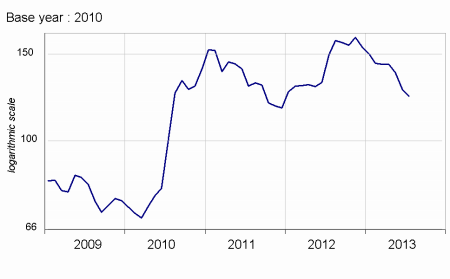
Cereal prices kept on decreasing in July (–3.3 %) as a result of record harvests in the Northern hemisphere.
graphiquecereal – Production prices of cereals
Oleaginous prices tumbled in July (–11.8 %), particularly that of rape (-13.9 %), the main oleaginous good growed in France. In fact, the Ukrainian harvests of rape turned out to be very significant, and soy prices, a seed which is partially substituable, suffered from the announcement of a surge of sowed areas in the United States
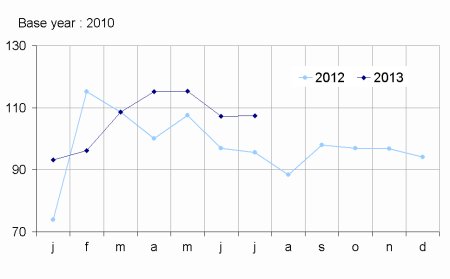
In July, potato prices more than doubled compared to the same month last year (+138.1 %), due to a marked shortfall of supply in North-Western Europe.
Wine prices increased in July (+0.9 %), and in a remarkable way over one year (13.9 %). The prices for some PDO wines were sustained by the export demand. The less significant crop last autumn led to a rise in prices for other wines.
Fresh fruits prices increased year-over-year (+19.1 %). Apricots and peaches prices rose due to bad weather conditions and a diminishing planted area. On the other hand, cherries decreased as a result of a bigger production than last year.
graphiquevegetable – Production prices of fresh vegetables
Fresh vegetables prices rose year-over-year (+12.3 %). The coming of the summer heat increased the demand for seasonal vegetables that were hardly filled by the supply for some of them (cucumber, melon), as their growings were delayed by the dull spring . On the other hand, the bright sun in July accelerated well the maturity of tomatoes, allowing to satisfy the rising demand for this vegetable as well, which is very consumed during summer time.
graphiquepig – Production prices of pigs ans big cattle
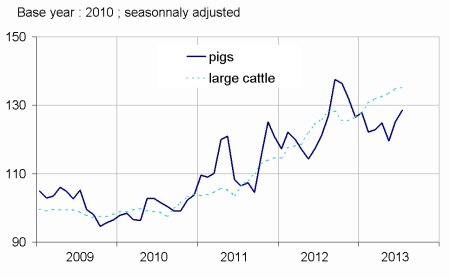
On a seasonally adjusted basis, animals prices increased a little in July (+0.8 %). Pigs ans sheep became more expensive : the coming of summer-like temperatures made the consumption of grilled meat pick up. Egg prices plumeted over one year : the strong recovery of production came after the implementation of new sanitary standards in 2012 which had led to a significant drop in the output.
tableauTab1 – Indices of producer prices of agricultural products (IPPAP)
| Variation as % over | |||||
|---|---|---|---|---|---|
| weights | July 2013 | a month | 3 month | a year | |
| raw | Seasonally adjusted data | raw | |||
| Agricultural goods output | 1000 | 122.2 | –1.0 | –3.0 | +2.9 |
| excluding fruits and vegetables | 900 | 123.3 | –0.9 | –3.1 | +1.9 |
| Crop output (excluding fruits and vegetables) | 502 | 123.4 | –2.0 | –6.6 | –0.7 |
| Cereals | 190 | 123.1 | –3.3 | –13.9 | –17.7 |
| of which soft wheat | 113 | 116.4 | –4.9 | –20.2 | –22.1 |
| grain maize | 42 | 133.0 | –0.5 | 0.0 | –6.8 |
| Potatoes | 26 | 218.7 | /// | /// | +138.1 |
| Wines | 171 | 118.9 | +0.9 | +0.6 | +13.9 |
| Protected designation of origine | 135 | 117.6 | +1.2 | +0.9 | +13.5 |
| other wines | 36 | 123.6 | –0.1 | –0.4 | +15.1 |
| Oleaginous | 49 | 106.8 | –11.8 | –16.0 | –21.0 |
| Horticultural products | 31 | 103.8 | +0.4 | +1.9 | +3.3 |
| Other crop products | 34 | 117.1 | –0.2 | –1.0 | +3.2 |
| Fruits and vegetables (1) | 100 | 111.0 | /// | /// | +14.1 |
| Fresh vegetables | 93 | 107.4 | /// | /// | +12.3 |
| Fresh fruits | 41 | 117.5 | /// | /// | +19.1 |
| Animal output | 398 | 123.2 | +0.5 | +1.7 | +5.4 |
| Animals | 234 | 127.3 | +0.8 | +1.3 | +6.6 |
| of which large cattle | 96 | 134.2 | +0.2 | +2.2 | +7.1 |
| calves | 26 | 106.8 | –0.8 | –6.4 | +0.1 |
| pigs | 54 | 132.5 | +2.7 | +2.9 | +6.2 |
| sheep | 10 | 117.7 | +5.2 | +12.2 | +17.3 |
| poultry | 44 | 122.6 | –0.4 | –0.9 | +7.9 |
| of which chicken | 18 | 124.9 | –0.4 | –0.5 | +9.8 |
| Milk | 149 | 119.4 | 0.0 | +3.8 | +8.4 |
| of which cow milk (2) | 139 | 120.9 | 0.0 | +4.0 | +8.7 |
| Eggs | 15 | 95.8 | –0.1 | –10.7 | –33.0 |
- (1) Including vegetables for industry.
- (2) The price for June is not yet known and therefore is estimated by carrying forward the seasonally adjusted price from June
- Sources: INSEE - SSP (Ministry of Agriculture)
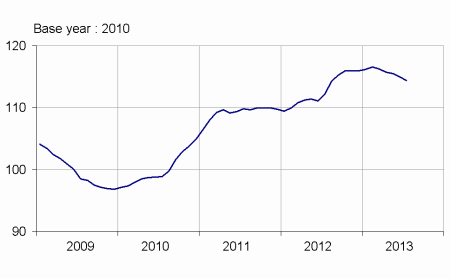
Purchase prices of the means of agricultural production decreased in July.
Purchase prices of the means of agricultural production continued to dip in July (-0.5 %), due noticeably to the decrease in prices for some inputs (fertilisers and food for animals). Investment prices slightly dropped (-0.2%).
graphiquemeans – Purchase prices of the means of agricultural production
tableauTab2 – Indices of purchase prices of the means of agricultural production (IPAMPA)
| weights | July 2013 | Variation as % over | |||
|---|---|---|---|---|---|
| a month | 3 month | a year | |||
| Total input | 1000 | 114.8 | –0.5 | –1.0 | +2.1 |
| Intermediate consumptions | 755 | 117.8 | –0.5 | –1.3 | +2.2 |
| Energy (1) | 102 | 118.9 | +0.9 | +1.1 | –0.7 |
| Seeds | 67 | 108.4 | –0.2 | +0.1 | +4.4 |
| Fertilisers and soil improvers | 100 | 121.3 | –2.3 | –6.5 | –4.9 |
| Plant protection products | 83 | 101.3 | +0.4 | +0.6 | +0.9 |
| Animal feed | 211 | 133.8 | –1.2 | –2.2 | +6.6 |
| Veterinary expenses | 50 | 109.0 | +0.3 | +0.8 | +3.2 |
| Small equipment and tools | 16 | 109.4 | +0.5 | +0.9 | +2.7 |
| Maintenance of materials | 73 | 108.8 | +0.2 | +0.6 | +2.6 |
| Maintenance of buildings | 9 | 106.7 | –0.3 | –0.3 | +0.9 |
| Other goods and services | 52 | 106.2 | +0.1 | +0.4 | +2.1 |
| Goods and services contributing to investment | 245 | 105.8 | –0.2 | +0.1 | +1.9 |
| Material | 193 | 105.3 | –0.1 | +0.2 | +2.1 |
| Tractors | 82 | 105.4 | –0.3 | –0.2 | +1.2 |
| Machinery and plant for cultivation | 37 | 105.3 | 0.0 | +0.8 | +4.0 |
| Machinery and plant for harvesting | 43 | 106.4 | 0.0 | +0.4 | +2.9 |
| Utility vehicles | 19 | 103.0 | +0.2 | +0.5 | +0.3 |
| Buildings | 52 | 107.4 | –0.5 | –0.5 | +0.8 |
- (1) The repayment of the domestic tax on energy products (TICPE) benefiting farmers has been applied in advance for the year 2013
- Sources: INSEE - SSP (Ministry of Agriculture)
Documentation
Methodology (pdf,122 Ko)
Pour en savoir plus
Time series : Indices of agricultural prices
