


 25 June 2014
2014- n° 145In June 2014, the business climate indicator slightly declines in the retail trade
and in the trade and repair of motor vehicles Monthly survey of retailing - June 2014
25 June 2014
2014- n° 145In June 2014, the business climate indicator slightly declines in the retail trade
and in the trade and repair of motor vehicles Monthly survey of retailing - June 2014
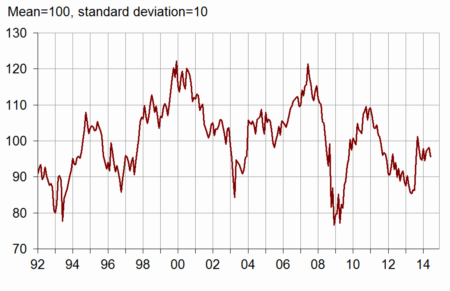
According to the managers surveyed in June 2014, the business climate synthetic indicator slightly declines in the retail trade and in the trade and repair of motor vehicles. Its has lost two points and has stayed still below its long-term average.
According to the managers surveyed in June 2014, the business climate synthetic indicator slightly declines in the retail trade and in the trade and repair of motor vehicles. Its has lost two points and has stayed still below its long-term average.
graphiquegraph_indsynt_en – Business climate synthetic indicator
More pessimistic expectations
As many business leaders than on last month have declared a decrease in their past sales, the corresponding balance remaining under its average. About forecasts, expected sales, ordering intentions and general business outlook have slightly decreased, showing that the managers remain pessimistic about the economic situation in the trade sector. Each of the three balances has stayed under its average.
Stocks are still estimed under their normal level.
In June, as many business leaders than in May expect a fall in prices. The corresponding balance remains at the mid-2009 low level.
graphiqueGraph_ventes_ic_en – Recent sales and ordering intentions

tableautab1_en – Global data
| Ave. (1) | March 14 | April 14 | May 14 | June 14 | |
|---|---|---|---|---|---|
| Business climate | 100 | 97 | 98 | 98 | 96 |
| General business outlook | –30 | –36 | –36 | –35 | –37 |
| Recent sales | –7 | –17 | –22 | –15 | –16 |
| Expected sales | –3 | –12 | –7 | –8 | –12 |
| Ordering intentions | –9 | –10 | –10 | –11 | –13 |
| Stocks | 11 | 3 | 4 | 7 | 7 |
| Past selling prices (2) | –6 | –9 | –18 | ||
| Expected selling prices | –3 | –12 | –16 | –15 | –15 |
| Cash position (2) | –15 | –22 | –19 | ||
| Workforce size: recent trend | 0 | –7 | –4 | –3 | –3 |
| Workforce size: future trend | –2 | –8 | –4 | –3 | –7 |
- (1) Average since 1991 (2004 for recent and expected sales and ordering intentions).
- (2) Bi-monthly question (odd-numbered months).
- Source: monthly survey in the retail trade and in the trade and repair of motor vehicles - INSEE
More job losses
According to business managers, workforce trend has stabilized over the last few months, but might intensify over the next few months, in both retail trade and trade of motor vehicles.
Retail trade
Still low estimated prices
In both non-specialized and specialized trade, as many retailers than in May have declared a fall in their past activity. Each of the two balances remains below its average, the non-specialized trade one being significantly low.
In the whole retail trade, expected sales and ordering intentions have carried on decreasing, each of the corresponding balances being still under its average.
Stocks are estimed stable, below their normal level.
The balances concerning expected prices remain very low in both non-specialized and specialized trade. In non-specialized trade, the balance stays at the mid-2009 low level.
Trade and repair of motor vehicles
graphiquegraph_ventes_ic_auto_en – Recent sales and ordering intentions in motor vehicles

Declining forecasts
In trade and repair of motor vehicles, past activity has slightly declined, but the corresponding balance is still above its average. Expected sales and ordering intentions go on decreasing. Each of the two balances is under its average from now on.
The level of stocks is still considered very low.
As many managers than in May forecast a drop in expected prices.
tableautab2_en – Detailed data
| Ave. (1) | March 14 | April 14 | May 14 | June 14 | |
|---|---|---|---|---|---|
| Retail trade - Global data | |||||
| Recent sales | –5 | –19 | –25 | –20 | –19 |
| Expected sales | 0 | –12 | –6 | –7 | –12 |
| Ordering intentions | –7 | –11 | –10 | –11 | –13 |
| Stocks | 10 | 4 | 5 | 8 | 7 |
| Past selling prices (2) | –8 | –14 | –24 | ||
| Expected selling prices | –5 | –13 | –22 | –22 | –20 |
| Cash position (2) | –13 | –21 | –19 | ||
| Workforce size: recent trend | 1 | –5 | –1 | 1 | –1 |
| Workforce size: future trend | –2 | –5 | –3 | 0 | –5 |
| Non-specialized retail trade | |||||
| Recent sales | –2 | –17 | –33 | –22 | –22 |
| Expected sales | 6 | –12 | –2 | 3 | –3 |
| Ordering intentions | 1 | –8 | –2 | –2 | 0 |
| Stocks | 7 | 3 | 2 | 2 | 4 |
| Past selling prices (2) | –8 | –22 | –32 | ||
| Expected selling prices | –5 | –20 | –27 | –26 | –23 |
| Cash position (2) | –7 | –14 | –12 | ||
| Specialized retail trade | |||||
| Recent sales | –9 | –21 | –16 | –17 | –16 |
| Expected sales | –7 | –16 | –11 | –17 | –17 |
| Ordering intentions | –17 | –19 | –16 | –23 | –24 |
| Stocks | 14 | 4 | 9 | 14 | 12 |
| Past selling prices (2) | –8 | –5 | –15 | ||
| Expected selling prices | –4 | –6 | –16 | –16 | –17 |
| Cash position (2) | –22 | –28 | –27 | ||
| Trade and repair of motor cars and motorcycles | |||||
| Recent sales | –11 | –12 | –14 | –4 | –9 |
| Expected sales | –10 | –10 | –7 | –12 | –14 |
| Ordering intentions | –14 | –4 | –2 | –5 | –17 |
| Stocks | 15 | 0 | 3 | 5 | 5 |
| Past selling prices (2) | 1 | 1 | –4 | ||
| Expected selling prices | 4 | –7 | –3 | 1 | 0 |
| Cash position (2) | –26 | –26 | –21 | ||
| Workforce size: recent trend | –10 | –14 | –13 | –15 | –9 |
| Workforce size: future trend | –8 | –13 | –5 | –10 | –13 |
- (1) Average since 1991 (2003 for trade and repair of motor vehicles and 2004 for recent and expected sales and ordering intentions).
- (2) Bi-monthly question (odd-numbered months).
- Source: monthly survey in the retail trade and in the trade and repair of motor vehicles - INSEE
Documentation
Methodology (pdf,129 Ko)
Pour en savoir plus
