


 28 February 2014
2014- n° 47In January 2014, Households consumption of goods decreased (-2.1%) with the fall in
car and energy expenditure Household consumption expenditure on goods - January 2014
28 February 2014
2014- n° 47In January 2014, Households consumption of goods decreased (-2.1%) with the fall in
car and energy expenditure Household consumption expenditure on goods - January 2014
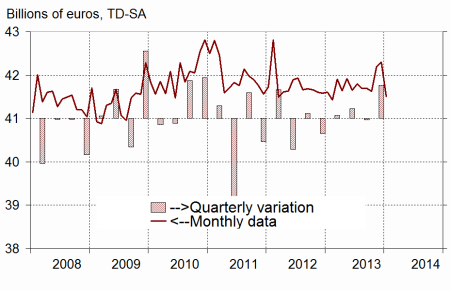
In January, households expenditure on goods decreased by 2.1% in volume*, after a 0.2% increase in December. This decrease is mainly attributable to a fall in car purchases and to a decrease of energy consumption.
In January, households expenditure on goods decreased by 2.1% in volume*, after a 0.2% increase in December. This decrease is mainly attributable to a fall in car purchases and to a decrease of energy consumption.
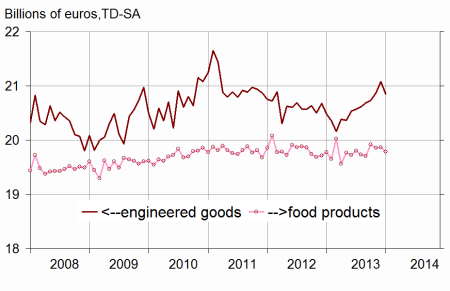
Engineered goods : decreasing
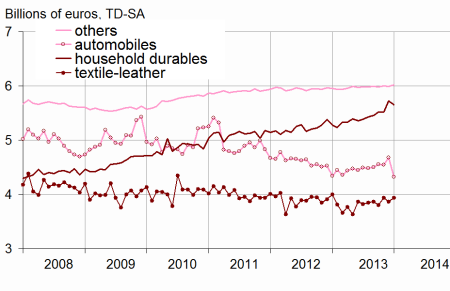
Durables: decreasing
After a bounce in December (+2.8%), households expenditure on durable goods declined in January (-4.3%), mainly because of the fall in car purchases. They fell in January (-7.7%) after an increase in December (+2.9%) due to households expecting a strenghtening of penalties on the purchase of cars from January 1st. Purchases in household durables slightly decreased (-1.5%) after an increase in December (+3.6%).
Textile-leather: increasing
Households consumption of textile and leather, thanks to a profitable sales season, edged up to their level of November (+1.9%, after -1.8%).
Other engineered goods: increasing
In january, consumption expenditure on other engineered goods picked up (+0.5% after -0.1% in December), especially those on hardware which bounced.
[* Volumes are chained and all figures are trading days and seasonally adjusted.]
graphiquegraph1_new_ang – Total consumption of goods
graphiquegraph2_new_ang – Food and engineered goods
graphiquegraph3_new_ang – Breakdown of engineered goods
Food products: decreasing
Consumption of food products, which flattened in December (+0.1 decreased anew in January (-0.5%). This decrease is mainly attributable to a decline of expenditure on tobacco products, following a price increase this month.
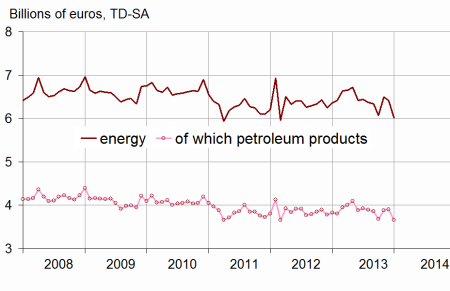
Energy: strongly decreasing
Households consumption of energy products decreased in January (-6.3% after -1.3%). After an already mild December, above average temperatures in January led to a decrease in expenditure on energy for heating purposes for the second consecutive month.
The evolutions of household consumption of goods in December is scaled up by 0.3 points
The change of household consumption of goods is now estimated at +0.2% in December, instead of -0.1% estimated for the previous publication.
This revision is mainly due to the integration of new information, notably regarding the expenditures on household durables, as well as the updating of the seasonal adjustment coefficients.
tableautab1_eng – Households consumption expenditures on goods
| Nov. | Dec. | Jan. | Jan.2014/ | |
|---|---|---|---|---|
| 2013 | 2013 | 2014 | Jan.2013 | |
| Food products | 14,854 | 14,868 | 14,790 | |
| Change (%) | –0,5 | 0,1 | –0,5 | 0,1 |
| Engineered goods | 20,874 | 21,078 | 20,736 | |
| change (%) | 0,7 | 1,0 | –1,6 | 1,2 |
| Durables | 10,950 | 11,257 | 10,769 | |
| change (%) | –0,1 | 2,8 | –4,3 | 2,5 |
| Of which Automobiles | 4,544 | 4,676 | 4,318 | |
| Change (%) | –0,3 | 2,9 | –7,7 | –0,6 |
| Of which Household durables | 5,522 | 5,719 | 5,656 | |
| Change (%) | 0,1 | 3,6 | –1,1 | 7,3 |
| Textile-leather | 3,935 | 3,864 | 3,939 | |
| Change (%) | 3,4 | –1,8 | 1,9 | –1,6 |
| Other engineered goods | 5,996 | 5,989 | 6,021 | |
| Change (%) | 0,2 | –0,1 | 0,5 | 1,1 |
| Energy | 6,497 | 6,416 | 6,011 | |
| Change (%) | 7,0 | –1,3 | –6,3 | –5,5 |
| Including petroleum products | 3,883 | 3,904 | 3,659 | |
| Change (%) | 5,5 | 0,6 | –6,3 | –4,3 |
| Total | 42,198 | 42,295 | 41,406 | |
| Change (%) | 1,4 | 0,2 | –2,1 | –0,5 |
| Manufactured goods | 36,372 | 36,674 | 36,114 | |
| Change (%) | 0,2 | 0,8 | –1,5 | 0,6 |
graphiquegraph4_new_ang – Energy
Documentation
Methodology (pdf,23 Ko)
Pour en savoir plus
