


 16 June 2014
2014- n° 141In Q1 2014, the labor cost index-wages and salaries increased by 0.5% while the labor
cost index-total labor cost decreased by 0.5% Labor cost index in industry, construction and services - 1st Quarter 2014
16 June 2014
2014- n° 141In Q1 2014, the labor cost index-wages and salaries increased by 0.5% while the labor
cost index-total labor cost decreased by 0.5% Labor cost index in industry, construction and services - 1st Quarter 2014
In the first quarter of 2014, the labor cost index (LCI) - wages & salaries for the business economy slowed down very slightly (+0.5% after +0.6%) in seasonally adjusted data.
Warning: Since the Q1 2013, the tax credit for encouraging competitiveness and jobs (CICE) was included in the calculation of the labor cost index as a subsidy received by the employer. The rate of the CICE has increased from 4 % to 6 % from the 1 st January of 2014. In Q4 2013, for business economy (excluding agriculture), the year-on-year changes of the labor cost index – total labor cost (+0.4%) is 1.8 points lower than what it would have been without CICE (+2.2%). The LCI – wages & salaries is not impacted.
The labor cost index - wages & salaries increased by 0.5%
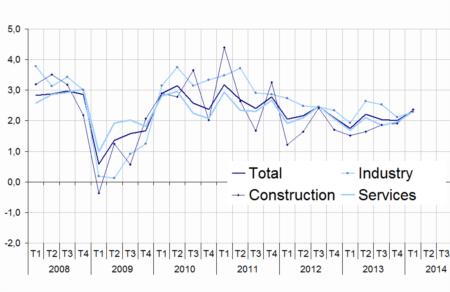
In the first quarter of 2014, the labor cost index (LCI) - wages & salaries for the business economy slowed down very slightly (+0.5% after +0.6%) in seasonally adjusted data. In year-on-year changes, the LCI - wages & salaries increased by 2.3% after +2.0% in the previous quarter. Work hours slightly decreased (-0.1% in year-on-year changes).
graphiqueGraphSSangl – LCI - wages & salaries : Year-on-year changes
- Sources : Acoss, Dares, Insee
Wages increased by 0.5% in industry
Wages increased by 0.5% in industry after +0.4%. In particular, they recovered in the water supply sector (+0.4% after -0.2%). As was the case in the previous quarter, they increased by 0.5 % in the manufacturing sector. In year–on–year changes, wages increased very slightly in industry (+2.3% after +2.1%).
Wages slowed down in services and construction
Wages increased by 0.4% in services after +0.6% in the fourth quarter. Particularly, they slowed down sharply in real estate (+0.3% after +1.7%). In year–on–year changes, wages increased by 2.3% in services. In construction, they slowed down in the first quarter of 2014 (+0.3% after +0.6%).
tableautableauSSangl – LCI - wages & salaries
| Quarterly changes (%) | Annual changes (%) | |||
|---|---|---|---|---|
| Q4-13 | Q1-14 | Q4-13 | Q1-14 | |
| Industry | 0.4 | 0.5 | 2.1 | 2.3 |
| Mining and quarrying | 0.2 | 1.5 | 1.7 | 2.7 |
| Manufacturing | 0.5 | 0.5 | 2.3 | 2.5 |
| Electricity, gas, steam and air conditioning supply | 0.3 | 0.6 | 0.4 | –0.1 |
| Water supply; sewerage, waste management and remediation activities | –0.2 | 0.4 | 0.9 | 1.2 |
| Services | 0.6 | 0.4 | 2.0 | 2.3 |
| Wholesale and retail trade; repair of motor vehicles and motorcycles | 0.5 | 0.5 | 1.8 | 2.2 |
| Transportation and storage | 0.6 | 0.0 | 1.9 | 1.3 |
| Accommodation and food service activities | –0.1 | 0.5 | 1.5 | 2.1 |
| Information and communication | 0.3 | 0.2 | 1.9 | 1.9 |
| Financial and insurance activities | 0.4 | 1.4 | 1.2 | 3.7 |
| Real estate activities | 1.7 | 0.3 | 2.6 | 2.5 |
| Professional, scientific and technical activities | 0.7 | 0.7 | 1.8 | 2.4 |
| Administrative and support service activities | 1.3 | –0.2 | 3.2 | 2.6 |
| Construction | 0.6 | 0.3 | 1.9 | 2.4 |
| TOTAL | 0.6 | 0.5 | 2.0 | 2.3 |
- Sources: Acoss, Dares, Insee
Small upward revision
The evolution of wages during the fourth quarter of 2013 is revised upwards by 0.1 point in quarterly variation but remained unchanged in annual variation.
The labor cost index - total labor cost decreased by 0.5%
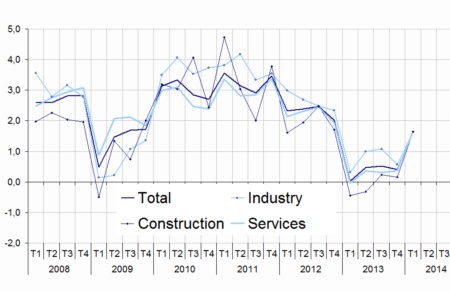
Since the 1st January of 2014, the tax credit rate for encouraging competitiveness and jobs (CICE), included in the calculation of the LCI-total labor cost as a subsidy received by the employer, has been raised from 4% to 6%. In the first quarter of 2014, the labor cost index (LCI) - total labor cost for the business economy slowed down by 0.5% in seasonnally adjusted date, after +0.6% in the fourth quarter.
In year-on-year changes, the LCI - total labor cost sharply sped up in the first quarter (+1.7%). It slowed down between the first quarter of 2012 and 2013 because of the implementation of the CICE (at 4%) on 1st January, 2013. This quarter, the year-on-year changes is calculated with the rise of the rate of the CICE at 6% on 1st January, 2014. Without this effect, the LCI - total labor cost would have increased by 2.6% in year-on-year changes.
graphiqueGraphSCangl – LCI - total labor cost : Year-on-year changes
- Sources : Acoss, Dares, Insee
No revision of the index of the fourth quarter 2013
The evolution of the labor cost index (LCI) – total labor cost in the fourth quarter of 2013 is not revised.
Moreover, the LCI - total labor cost has been revised between 2000 and 2008 consecutively to an improvement in the methodology (for more information about this change see the frame “Learn more”).
tableautableauSCangl – LCI - total labor cost
| Quarterly changes (%) | Annual changes(%) | |||
|---|---|---|---|---|
| Q4-13 | Q1-14 | Q4-13 | Q1-14 | |
| Industry | 0.5 | –0.4 | 0.6 | 1.6 |
| Mining and quarrying | 0.3 | 0.5 | –0.5 | 1.8 |
| Manufacturing | 0.5 | –0.5 | 0.6 | 1.8 |
| Electricity, gas, steam and air conditioning supply | 0.3 | 0.1 | –0.6 | –0.5 |
| Water supply; sewerage, waste management and remediation activities | 0.1 | –0.8 | –0.8 | 0.4 |
| Services | 0.7 | –0.5 | 0.4 | 1.7 |
| Wholesale and retail trade; repair of motor vehicles and motorcycles | 0.7 | –0.8 | 0.0 | 1.5 |
| Transportation and storage | 0.8 | –1.2 | 0.1 | 0.3 |
| Accommodation and food service activities | –0.2 | –0.9 | –0.9 | 1.1 |
| Information and communication | 0.3 | –0.4 | 0.9 | 1.4 |
| Financial and insurance activities | 0.5 | 0.9 | 0.3 | 3.4 |
| Real estate activities | 2.1 | –0.9 | 1.1 | 2.0 |
| Professional, scientific and technical activities | 0.7 | 0.1 | 0.7 | 1.9 |
| Administrative and support service activities | 1.2 | –1.3 | 0.9 | 1.7 |
| Construction | 0.7 | –0.8 | 0.1 | 1.6 |
| TOTAL | 0.6 | –0.5 | 0.4 | 1.7 |
- Sources: Acoss, Dares, Insee
tableauCICE – LCI - total labor cost without CICE
| Quarterly changes (%) | Annual changes (%) | |||
|---|---|---|---|---|
| Q4-13 | Q1-14 | Q4-13 | Q1-14 | |
| Industry | 0.5 | 0.5 | 2.3 | 2.5 |
| Mining and quarrying | 0.3 | 1.5 | 1.5 | 2.8 |
| Manufacturing | 0.5 | 0.4 | 2.4 | 2.7 |
| Electricity, gas, steam and air conditioning supply | 0.3 | 0.7 | 0.5 | 0.1 |
| Water supply; sewerage, waste management and remediation activities | 0.1 | 0.2 | 1.2 | 1.4 |
| Services | 0.7 | 0.4 | 2.1 | 2.6 |
| Wholesale and retail trade; repair of motor vehicles and motorcycles | 0.7 | 0.3 | 2.1 | 2.5 |
| Transportation and storage | 0.8 | –0.2 | 2.2 | 1.4 |
| Accommodation and food service activities | –0.2 | 0.5 | 1.8 | 2.5 |
| Information and communication | 0.3 | 0.2 | 1.9 | 2.0 |
| Financial and insurance activities | 0.5 | 1.3 | 1.2 | 3.9 |
| Real estate activities | 2.1 | 0.0 | 2.9 | 2.9 |
| Professional, scientific and technical activities | 0.7 | 0.7 | 1.9 | 2.6 |
| Administrative and support service activities | 1.2 | 0.0 | 3.3 | 2.9 |
| Construction | 0.7 | 0.3 | 2.4 | 2.8 |
| TOTAL | 0.6 | 0.4 | 2.2 | 2.6 |
- Sources: Acoss, Dares, Insee
Pour en savoir plus
