


 31 January 2014
2014- n° 29Despite a slight decline in December (-0.1%), household consumption on goods increased
over the fourth quarter (+0.8%) Household consumption expenditure on goods - December 2013
31 January 2014
2014- n° 29Despite a slight decline in December (-0.1%), household consumption on goods increased
over the fourth quarter (+0.8%) Household consumption expenditure on goods - December 2013
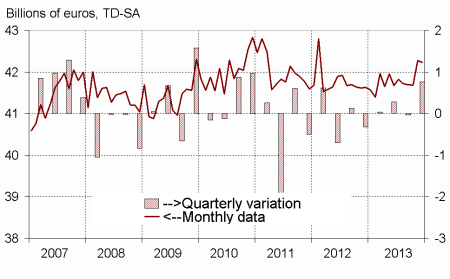
In December, household consumption expenditure on goods declined slightly: –0.1% in volume*, after +1.4% in November. But taking into account the increases over the previous months, household consumption expenditure on goods rose over Q4. (+0.8%, after a stability in Q3). This rebound was mainly attributable to the acceleration in purchases on durables and in consumption of food products, as well as to the lower decline in consumption of energy products. It offset the downturn at the beginning of the year: overall in 2013 expenditure on goods rose slightly (+0.1% after –0.5% in 2012).
In December, household consumption expenditure on goods declined slightly: –0.1% in volume*, after +1.4% in November. But taking into account the increases over the previous months, household consumption expenditure on goods rose over Q4. (+0.8%, after a stability in Q3). This rebound was mainly attributable to the acceleration in purchases on durables and in consumption of food products, as well as to the lower decline in consumption of energy products. It offset the downturn at the beginning of the year: overall in 2013 expenditure on goods rose slightly (+0.1% after –0.5% in 2012).
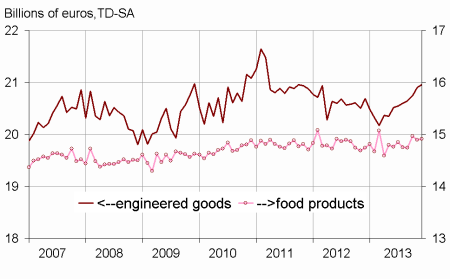
Engineered goods : increasing again
Durables: rebound in December
Household expenditure on durable goods bounced back in December (+1.9%, after –0.2% in November). This growth ensued mainly from the rebound in car purchases (+2.7%, after –0.2%), as households anticipated a strenghtening of penalties on the purchase of the most polluting cars implemented on January 1st, 2014. Purchases of household durables accelerated as well (+1.2%, after –0.3%).
Over the fourth quarter, expenditure on durable goods increased by 2.0%, after +0.9%: car purchases accelerated (+2.2%, after +0.9%), similarly as purchases on household durables (+1.9%, after +0.1%). However the rise of the three last quarters did not allow to offset the decline at the beginning of the year and consumption of household durables went down by 0.4% over the year (after –3.2% in 2012).
[* Volumes are chained and all figures are trading days and seasonally adjusted.]
graphiquegraph1_new_ang – Total consumption of goods
graphiquegraph2_new_ang – Food and engineered goods
graphiquegraph3_new_ang – Breakdown of engineered goods
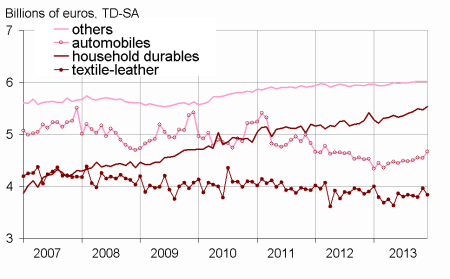
Textile-leather: marked decline in December
In December, consumption of textile, clothing and leather stepped back (–3.2%) after bouncing back in November (+4.4%). Yet it continues to grow over Q4 (+1.2% after +1.9% in Q3).
Other engineered goods: almost stable in December
Consumption expenditure on other engineered goods were almost stable in December (–0.1%, after +0.1% in November), particularly in purchases on hardware. It went up slightly in Q4 (+0.3%, as in Q3).
Food products: rising
In December, consumption of food products rose slightly (+0.1% after –0.5% in November), mainly due to a rebound in expenditure on tobacco products which fell sharply in November. It continues to go up over the quarter (+1.0%, after +0.5% in Q3).
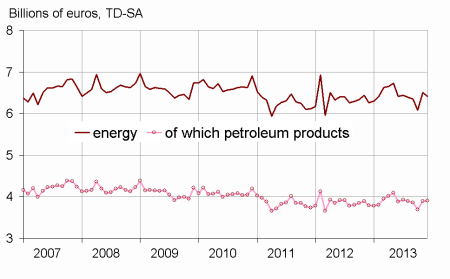
Energy: decreasing
After bouncing back in November (+7.0%) household consumption of energy products dropped in December (–1.4%), reflecting the impact of above average temperatures on heating expenditure (electricity, gas, fuel). Conversely, fuel expenditure picked up. Over the quarter, consumption of energy products dipped (– 0.9% after –3.1% in Q3). They grew by 1.4% in 2013.
The increase in November is confirmed
The increase of household consumption expenditure on goods is still estimated at +1.4% in November, as it was for the previous publication: some minor revisions offset each other.
graphiquegraph4_new_ang – Energy
graphiqueenglish_trim – Household consumption expenditure on goods
| Oct. | Nov. | Dec. | Dec.2013/ | Q4 13/ | |
|---|---|---|---|---|---|
| 2013 | 2013 | 2013 | Dec.2012 | Q3 13 | |
| Food products | 14.969 | 14,897 | 14,913 | ||
| Change (%) | 1.5 | –0.5 | 0.1 | 1.2 | 1.0 |
| Engineered goods | 20.739 | 20.903 | 20.955 | ||
| Change (%) | 0.4 | 0.8 | 0.2 | 1.3 | 1.3 |
| Durables | 10.942 | 10.920 | 11.125 | ||
| Change (%) | 1.1 | –0.2 | 1.9 | 2.7 | 2.0 |
| - Of which automobiles | 4.557 | 4.548 | 4.672 | ||
| Change (%) | 1.3 | –0.2 | 2.7 | 3.3 | 2.2 |
| - Of which household durables | 5.489 | 5.472 | 5.537 | ||
| Change (%) | 1.0 | –0.3 | 1.2 | 2.2 | 1.9 |
| Textile-leather | 3.798 | 3.965 | 3.839 | ||
| Change (%) | –0.7 | 4.4 | –3.2 | –1.7 | 1.2 |
| Other engineered goods | 6.014 | 6.021 | 6.014 | ||
| Change (%) | 0.1 | 0.1 | –0.1 | 0.8 | 0.3 |
| Energy | 6.080 | 6.503 | 6.412 | ||
| Change (%) | –4.1 | 7.0 | –1.4 | 2.5 | –0.9 |
| Including petroleum products | 3.687 | 3.888 | 3.900 | ||
| Change (%) | –4.5 | 5.5 | 0.3 | 2.9 | –1.8 |
| Total | 41.685 | 42.276 | 42.227 | ||
| Change (%) | 0.0 | 1.4 | –0.1 | 1.4 | 0.8 |
| Manufactured goods | 36.344 | 36.451 | 36.612 | ||
| Change (%) | 0.8 | 0.3 | 0.4 | 1.6 | 1.0 |
Documentation
Methodology (pdf,23 Ko)
Pour en savoir plus
