


 28 June 2013
2013- n° 150Significant decline in industrial prices on the French market Industrial Producer and Import Price Indices - May 2013
28 June 2013
2013- n° 150Significant decline in industrial prices on the French market Industrial Producer and Import Price Indices - May 2013
In May, French producer prices in industry fell significantly again (–1.2 % as in April). Prices for refined petroleum products decreased less markedly than in the previous month (–1.5 % following –5.2 %), but prices for electricity, gas, steam and air conditioning dropped considerably for the second month in a row (–5.3 % following –4.5 %), and prices for "other manufactured products" dipped (-0.5 %), following three months of almost no change.
Producer price indices in French industry
FRENCH MARKET: –1.2 % in May
In May, French producer prices in industry fell significantly again (–1.2 % as in April). Prices for refined petroleum products decreased less markedly than in the previous month (–1.5 % following –5.2 %), but prices for electricity, gas, steam and air conditioning dropped considerably for the second month in a row (–5.3 % following –4.5 %), and prices for "other manufactured products" dipped (-0.5 %), following three months of almost no change.
Prices for refined petroleum products dropped again
In May, the decline in prices for refined petroleum products, which had started in March, slowed down considerably. The price for Brent crude sourced from the North Sea fell significantly less rapidly in May than in April, in Euro terms (–0.4 % following –5.9 %) as well as in dollar terms (–0.8 % following –5.3 %).
Electricity prices, which are marked by the seasonality of the winter and summer rates, declined sharply again in May (–5.2 % following –6.0 % in April)
Food prices stabilized...
Food prices, which had slipped slightly in April, were almost unchanged in May (+0.1 % following –0.2 %). Prices for dairy products, which had decreased in April (–0.7 %), moved up slightly (+0.4 %). Meat prices rose again (+0.2 % ), while the fall in prices for sugar manufacturing slowed down (–0.3 % following –1.1 %).
...while prices for "other manufactured products" declined.
Prices for "other manufactured products" dipped (–0.5 %), following three months of stabiliby, due to the drop in prices for chemical and pharmaceutical products (–2.9 % and –1.2 %, respectively).
FOREIGN MARKETS: –0.6 % in May
Producer prices of French industrial products sold on foreign markets slipped for the second month in a row (–0.6 % in April as in May). As in April, prices for refined petroleum products decreased (–2.1 % following –2.9 %), but the fall was also significant in prices for electrical and electronical equipment (–0.5 %) and for "other manufactured products" (–0.5 %), and most notably for chemical products (–1.6 %).
ALL MARKETS: –1.0 % in May
On all markets, prices decreased significantly for the second month in a row (–1.0 % following –1.0 %). Year over year, prices were stable overall (–0.1 %): food prices increased strongly (+3.3 %), prices for "other manufactured products" dipped (–1.0 %), and prices for refined petroleum products fell sharply (–8.1 %).
Import price indices of industrial products: –0.2 % in May
Import prices dropped slightly in May (–0,2 %), after having significantly fallen in April (–1.2 %). Prices for "other manufactured products" declined again (–0.7 % following –0.5 % in April), buying prices for products from extractive industries and for refined petroleum products leveled off (+0.2 % and +0.0 % respectively).
graphiqueGraphique1_EN – Total Industry price indices

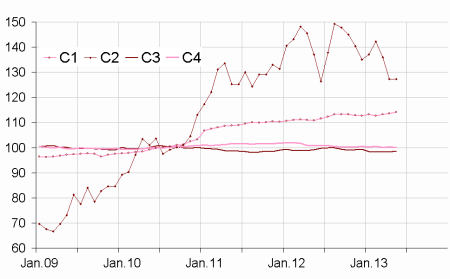
graphiqueGraphique2_EN – Producer price indices of manufactured products sold on the french market

graphiqueGraphique3_EN – Import price indices of manufactured products
tableauTableau1 – French Producer Price Indices in industry according to the market where the products are sold:
| Change in % | ||||
|---|---|---|---|---|
| Levels A 10 and A 17 in CPF rev. 2, 2008 | Weight | May 13 | In 1 month | In 1 year |
| French market | ||||
| BE:TOTAL INDUSTRY | 1000 | 107.2 | –1.2 | –0.1 |
| (DE) Mining and quarrying, energy, water | 226 | 108.2 | –4.0 | –0.1 |
| CZ: Manufactured prod. | 774 | 106.9 | –0.4 | –0.2 |
| (C1) Food products, beverages, tobacco | 196 | 111.6 | 0.1 | 3.4 |
| (C2) Coke and refined petroleum products | 49 | 127.7 | –1.5 | –7.4 |
| (C3) Electrical & electronic equip., computers, mach. | 53 | 102.2 | –0.4 | 0.1 |
| (C4) Transport equipment | 80 | 102.6 | –0.1 | –0.7 |
| (C5) Other man. products | 396 | 103.4 | –0.5 | –0.9 |
| Foreign markets | ||||
| BE:TOTAL INDUSTRY | 1000 | 103.5 | –0.6 | –0.7 |
| CZ: Manufactured prod. | 980 | 103.9 | –0.4 | –0.6 |
| (C1) Food products, beverages, tobacco | 100 | 110.8 | –0.1 | 2.6 |
| (C2) Coke and refined petroleum products | 37 | 125.7 | –2.1 | –10.1 |
| (C3) Electrical & electronic equip., computers, mach. | 194 | 99.2 | –0.5 | –0.9 |
| (C4) Transport equipment | 252 | 103.8 | 0.1 | 1.1 |
| (C5) Other man. products | 397 | 102.7 | –0.5 | –1.2 |
| All markets | ||||
| BE:TOTAL INDUSTRY | 1000 | 106.2 | –1.0 | –0.1 |
| CZ: Manufactured prod. | 845 | 105.7 | –0.4 | –0.4 |
| (C1) Food products, beverages, tobacco | 163 | 111.5 | 0.0 | 3.3 |
| (C2) Coke and refined petroleum products | 45 | 127.2 | –1.7 | –8.1 |
| (C3) Electrical & electronic equip., computers, mach. | 102 | 100.2 | –0.5 | –0.6 |
| (C4) Transport equipment | 140 | 103.4 | 0.0 | 0.4 |
| (C5) Other man. products | 395 | 103.2 | –0.5 | –1.0 |
tableauTableau2 – Import prices of industrial products
| Change en % | ||||
|---|---|---|---|---|
| Levels A 10 and A 17 of nomenclature CPF rev. 2, 2008 | Weight | May 13 | In 1 month | In 1 year |
| BE:TOTAL INDUSTRY | 1000 | 106.1 | –0.2 | –1.9 |
| CZ: Manufactured prod. | s | 103.9 | –0.2 | –1.3 |
| (C1) Food products, beverages, tobacco | 69 | 114.1 | 0.5 | 3.0 |
| (C2) Coke and refined petroleum products | 47 | 127.3 | 0.0 | –7.2 |
| (C3) Electrical & electronic equip., computers, mach. | 227 | 98.5 | 0.2 | –0.6 |
| (C4) Transport equipment | 147 | 100.2 | –0.1 | –0.6 |
| (C5) Other manufactured products | s | 104.1 | –0.7 | –1.8 |
- r: updated ; nd: non available ; s : confidential
tableauTableau3 – Revision of each index at total industry level
| Feb.13 / Jan.13 | Mar.13 / Feb.13 | Apr.13 / Mar.13 | |
|---|---|---|---|
| French producer prices in industry sold on: | |||
| - the French market | +0.1 | // | -0.3(1) |
| - the foreign markets | // | –0.1 | –0.2 |
| - all markets | // | // | –0.3 |
| Import prices of industrial products | +0.1 | +0.1 | –0.1 |
- (1) Reading note: the evolution of the index between Mar.2013 and Apr.2013 published last month was equal to -0.9 %. It is updated to -1.2 %; that is to say a revision of -0.3 %. This resulted mainly from the taking into account of seasonal movements of prices in distribution of electricity, after the rebasing of CPA 35.13 product since January 2013.
Pour en savoir plus
