


 31 May 2013
2013- n° 124In April 2013, households consumption of goods slightly decreased (-0.3%) Household consumption expenditure on goods - April 2013
31 May 2013
2013- n° 124In April 2013, households consumption of goods slightly decreased (-0.3%) Household consumption expenditure on goods - April 2013
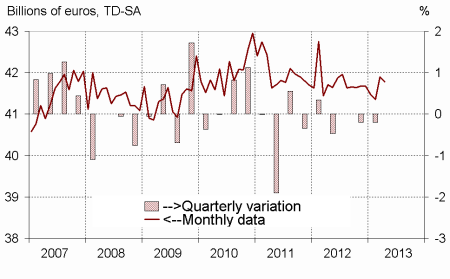
In April, households expenditure on goods decreased by 0.3% in volume*, after a 1.3% increase in March. The decrease in April was mainly attributable to a decrease in food products. On the other hand, purchases in durables and energy products increased.
In April, households expenditure on goods decreased by 0.3% in volume*, after a 1.3% increase in March. The decrease in April was mainly attributable to a decrease in food products. On the other hand, purchases in durables and energy products increased.
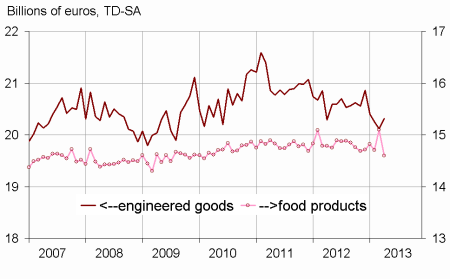
Engineered goods : increasing
Durables: increasing
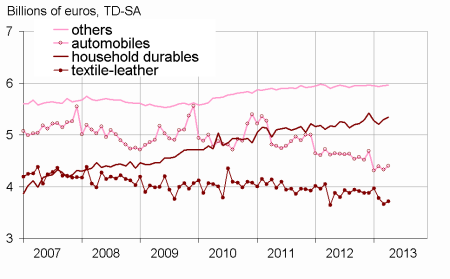
After a slight decrease in March (–0.2%), households expenditure on durable goods increased in April (+1.3%), especially for new vehicles. Expenditure on cars bounced in April (+1.8%, after –1.6% in March). Moreover, purchases in household durables increased again in April (+0.7%, after +1.7% in March).
Textile-leather: increasing too
After two consecutive months of decrease (–4.7%, then –3.1%), households consumption of textile and leather picked up in April (+1.5%).
Other engineered goods: slightly increasing
Consumption expenditure on other engineered goods slightly increased in April (+0.2%, as in March). In particular, hardware purchases stabilized.
[* Volumes are chained and all figures are trading days and seasonally adjusted.]
graphiquegraph1_new_ang – Total consumption of goods
graphiquegraph2_new_ang – Food and engineered goods
graphiquegraph3_new_ang – Decomposition of engineered goods
Food products: marked decline in April
After a very strong increase in March (+2.7%), which could be linked to an early Easter, consumption of food products bounced back in April (–3.3%).
Energy: increasing again
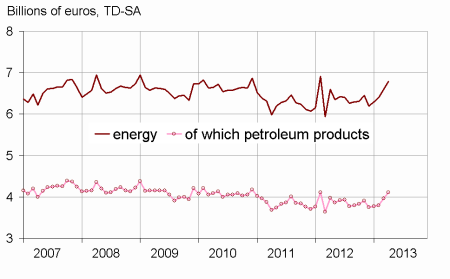
After three consecutive months of increase, households consumption of energy products increased again in April (+2.8%). This increase resulted mainly from dynamism of expenditure on fuel and gas.
The march increase is confirmed
The increase in consumption of goods in March is still estimated at +1.3%, as it was for the previous publication. Some minor revisions offset each other. Revisions notably come from the benchmarking on reviewed annual account, from the reestimation of calendar and seasonal adjustment models, and from the integration of new information.
tableautab1_eng – Households consumption expenditures on goods
| Févr. | Mars | Avril | Avr.13/ | |
|---|---|---|---|---|
| 2013 | 2013 | 2013 | Avr.12 | |
| Food products | 14.703 | 15.098 | 14.597 | |
| Change (%) | –0.8 | 2.7 | –3.3 | –1.3 |
| Engineered goods | 20.247 | 20.118 | 20.312 | |
| change (%) | –0.8 | –0.6 | 1.0 | 0.1 |
| Of which: | ||||
| Automobiles | 4.394 | 4.326 | 4.403 | |
| Change (%) | 2.0 | –1.6 | 1.8 | –4.6 |
| Household durables | 5.210 | 5.299 | 5.336 | |
| Change (%) | –1.1 | 1.7 | 0.7 | 3.3 |
| Textile-leather | 3.785 | 3.667 | 3.722 | |
| Change (%) | –4.7 | –3.1 | 1.5 | 2.0 |
| Other engineered goods | 5.936 | 5.950 | 5.960 | |
| Change (%) | –0.3 | 0.2 | 0.2 | 1.1 |
| Energy | 6.396 | 6.601 | 6.788 | |
| Change (%) | 1.6 | 3.2 | 2.8 | 2.9 |
| Including petroleum products | 3.798 | 3.959 | 4.114 | |
| Change (%) | 0.7 | 4.2 | 3.9 | 3.5 |
| Total | 41.354 | 41.903 | 41.782 | |
| Change (%) | –0.3 | 1.3 | –0.3 | 0.2 |
| Manufactured goods | 35.510 | 35.959 | 35.804 | |
| Change (%) | –0.8 | 1.3 | –0.4 | 0.2 |
graphiquegraph4_new_ang – Energy
Documentation
Methodology (pdf,23 Ko)
Pour en savoir plus
