


 12 June 2014
2014- n° 133The Consumer Prices Index stabilized in May 2014; it rose by 0.7%, year-on-year Consumer price index - final results - May 2014
12 June 2014
2014- n° 133The Consumer Prices Index stabilized in May 2014; it rose by 0.7%, year-on-year Consumer price index - final results - May 2014
As in April 2014, the Consumer Prices Index (CPI) stabilized in May 2014 and increased by 0.7% year-on-year. Excluding tobacco, the CPI also stabilized in May 2014 and rose by 0.6% compared with May 2013. Seasonally adjusted, the CPI grew slightly (+0.1% ; +0.7% year-on-year, as in April 2014). Thus, the consumer prices were broadly unchanged dispite the seasonal increase in food prices and in some services linked with holidays before the summer season. The other index components decreased slightly in May 2014, especially energy prices and those of manufactured products.
Monthly change: 0.0%; Year-on-year: +0.7%
As in April 2014, the Consumer Prices Index (CPI) stabilized in May 2014 and increased by 0.7% year-on-year. Excluding tobacco, the CPI also stabilized in May 2014 and rose by 0.6% compared with May 2013. Seasonally adjusted, the CPI grew slightly (+0.1% ; +0.7% year-on-year, as in April 2014). Thus, the consumer prices were broadly unchanged dispite the seasonal increase in food prices and in some services linked with holidays before the summer season. The other index components decreased slightly in May 2014, especially energy prices and those of manufactured products.
Seasonal increase in food prices
Despite an increase of 0.3% in May 2014, food prices declined again year-on-year (—0.9% down from —0.6% in the year ending in April 2014). The increase in food prices in May 2014 was mainly due to the seasonal rebound of the unprocessed food prices (+2.9%), especially those of fresh fruits (+6.0%). However, these increases were limited by ample supplies which have been stimulated by the better weather conditions in spring this year compared to last year. Hence, unprocessed food prices have pursued their fall compared to last year (—7.6% year-on-year in May 2014 after —6.2% in April 2014). Excluding fresh foodstuffs, food prices remained broadly unchanged since March 2014. In May 2014, only the prices of meat (+0.2%; +1.0% year-on-year after +1.1% in April 2014) and those of fishes and seafood (+1.1% and +0.6% compared to last year) increased in May 2014. After their significant recovery in previous months, the prices of dairy products stabilized in May 2014 (+1.7% year-on-year).
tableauOLE_LINK2 – Detailed figures for various groups
| Percentage change | ||||
|---|---|---|---|---|
| Items | Weight 2014 | Index May 2014 | Month rate | Annual rate |
| a) All households - France | ||||
| All items (00 E) | 10000 | 128.19 | 0.0 | 0.7 |
| All items SA (00 C) | 10000 | 127.75 | 0.1 | 0.7 |
| Food (4000 E) | 1653 | 132.45 | 0.3 | -0.9 |
| Fresh food (4001 E) | 210 | 141.82 | 2.9 | -7.6 |
| Food excluding fresh products (4002 E) | 1443 | 131.12 | 0.0 | 0.2 |
| Tobacco (4034 E) | 204 | 258.56 | 0.0 | 6.9 |
| MANUFACTURED PRODUCTS (4003 E) | 2653 | 101.09 | -0.1 | -0.8 |
| Clothing and footwear (4004 E) | 438 | 111.93 | 0.1 | 0.2 |
| Medical products (4005 E) | 434 | 78.61 | -0.2 | -2.6 |
| Other manufactured products (4006 E) | 1781 | 104.20 | -0.1 | -0.6 |
| ENERGY (4007 E) | 850 | 178.63 | -0.1 | 1.1 |
| Petroleum products (4008 E) | 475 | 201.72 | 0.1 | -1.5 |
| SERVICES (4009 E) | 4640 | 135.72 | 0.0 | 1.8 |
| Actual rentals and services for dwellings (4010 E) | 748 | 141.37 | -0.6 | 1.5 |
| Medical services (4011 E) | 552 | 122.26 | -0.1 | 0.2 |
| Transport and communication services (4012 E) | 503 | 95.48 | -1.0 | 1.3 |
| Other services (4013 E) | 2837 | 146.55 | 0.4 | 2.3 |
| ALL ITEMS EXCLUDING RENTALS AND TOBACCO (5000 E) | 9202 | 125.65 | 0.0 | 0.5 |
| ALL ITEMS EXCLUDING TOBACCO (4018 E) | 9796 | 126.27 | 0.0 | 0.6 |
| b) Manual or clerical worker headed urban households - France | ||||
| ALL ITEMS EXCLUDING TOBACCO (4018 D) | 9707 | 126.05 | 0.0 | 0.5 |
| ALL ITEMS (00 D) | 10000 | 128.85 | 0.0 | 0.7 |
| c) Households that belong to the lowest equivalized disposable income quintile - France | ||||
| ALL ITEMS EXCLUDING TOBACCO (4018 Q) | 9679 | 127.36 | 0.0 | 0.5 |
- Source : Insee - Consumer Price Indexes
tableauTableau1English – Detailed figures for Core inflation* and HICP**
| Percentage change | ||||
|---|---|---|---|---|
| Items | Weight 2014 | Index May 2014 | Month rate | Annual rate |
| All items "Core inflation" (4022 S) | 6053 | 122.40 | 0.0 | 0.3 |
| Food excluding fresh products, meat, milk and exotic products (4019 S) | 713 | 125.25 | -0.3 | -0.7 |
| Manufactured products (4020 S) | 2162 | 104.91 | -0.2 | -0.8 |
| Services including actual rentals and services for dwellings (4021 S) | 3178 | 139.03 | 0.2 | 1.2 |
| All items HICP (00 H) | 115.92 | 0.0 | 0.8 | |
- * ISJ : Core inflation indicator excludes public sector prices, the most volatile consumer prices and the tax measures. Seasonally adjusted, this index is computed for all households in France excluding overseas departments and territories (base 100 1998).
- **HICP : Harmonised Indices of Consumer Prices are designed for international comparison of consumer price inflation between European Member states of the Union. This index is computed for all households in France (base 100 2005).
- Source : Insee - Consumer Price Indexes
graphiqueGraphique1English – Consumer price index (IPC) and Core inflation (ISJ) – year-on-year changes
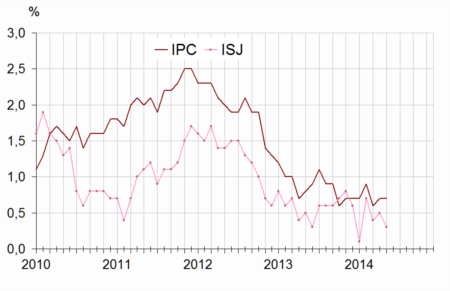
- Source : Insee - Consumer Price Indexes
Service prices broadly stable in May 2014
In May 2014, the service prices were broadly unchanged (+1.8% year-on-year). However, this relative inertia hid contrasting developments according to different items of consumption. On one hand, as every year in May, the prices of services dedicated to housing fell (—0.6%; +1.5% compared with the same month one year ago) due to the application of summer rates for collective heating (—27.5%; +0.4% year-on-year). On the other hand, the prices of some services dedicated to tourism increased before the summer season (+0.5%; +3.2% year-on-year for restaurants and hotels; +14.2% and —1.8% year-on-year for package holidays). Conversely, due to the change of the calendar of spring holidays, air fares fell by 5.8% in May 2014 after their rebound in April 2014 (+10.7%) and were again down compared to last year (—3.1% year-on-year in May 2014 after +3.3% in April 2014 and —5.0% in march 2014).
New decline of manufactured product prices
The prices of manufactured goods were again drawn down in May 2014 (—0.1%) after they stabilized in April 2014. Year-on-year, they accentuated their fall in May (—0.8% after —0.7% in april 2014), in particular in relation with the long term decline in the prices of heath products (—0.2%; —2.6% year-on-year) and those of high tech goods (—0.7% and —7.2% year-on-year for audio-visual, photographic and information processing equipments; —2.1% and —15.6% for telephone equipements). In addition, some sale promotions involved various products (household textiles, glassware, tableware and household utensils, etc.) before summer sales. Moreover, the prices of clothing and footwear were sluggish in may 2014 (+0.1%). Year-on-year, they decelerated, with an annual growth rate of +0.2% in May 2014 after +0.6% in April 2014.
Slight decrease in energy prices
In May 2014, energy prices went down by 0.1% (+1.0% year-on-year) , mainly due to the decrease in city gas prices (—0.7%; —0.1% year-on-year), the prices of petroleum products, both heating fuels and motor fuels, remained almost steady in May 2014 (+0.1% and —1.5% compared with the same month one year ago). As in April 2014, the electricity prices were unchanged in May 2014 and rose by 6.9% compared with the same month one year ago.
Core inflation went down in May 2014
In May 2014, the core inflation indicator (ISJ) remained unchanged from April 2014 and was up 0.3% compared with the same month one year ago (down from +0.5% in April 2014). The Harmonized Index of Consumer Prices (HICP) was stable in May 2014 and rose by 0.8% year-on-year (as in April 2014).
Pour en savoir plus
