


 28 May 2014
2014- n° 123In April 2014, household consumption of goods declined slightly (-0.3%) Household consumption expenditure on goods - April 2014
28 May 2014
2014- n° 123In April 2014, household consumption of goods declined slightly (-0.3%) Household consumption expenditure on goods - April 2014
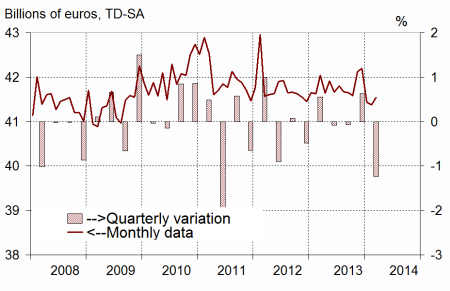
In April, household consumption expenditure on goods decreased by 0.3% in volume*, after a 0.6% increase in March. This decline resulted mainly from the decrease in expenditure on energy products.
In April, household consumption expenditure on goods decreased by 0.3% in volume*, after a 0.6% increase in March. This decline resulted mainly from the decrease in expenditure on energy products.
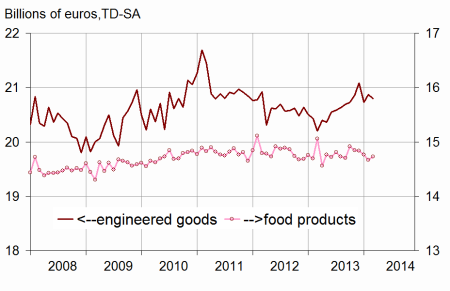
Engineered goods : dipping slightly
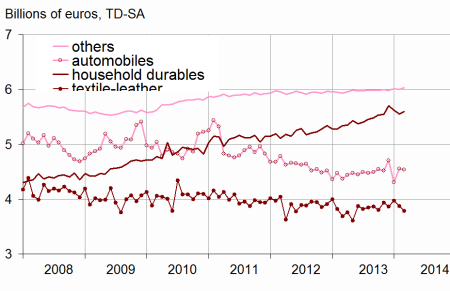
Durables: rising
Household expenditure on durable goods speeded up slightly in April (+0.5% after +0.3%), an acceleration mainly attributable to car purchases (+0.7% after +0.4% in March). Purchases of household durables decelerated but kept growing (+0.2% after 0.7%).
Textile-leather: decreasing again
Household consumption of textile, clothing and leather dropped again (–1.5%, after –1.7%). This has been the third consecutive month of decrease since February.
Other engineered goods: declining
In April, consumption expenditure on other engineered goods bounced back (–0.4% after +0.3%), especially because of a decline in expenditure on hardware.
* Volumes are chained and all figures are trading days and seasonally adjusted.
graphiquegraph1_new_ang – Total consumption of goods
graphiquegraph2_new_ang – Food and engineered goods
graphiquegraph3_new_ang – Breakdown of engineered goods
Food products: increasing again
Consumption of food products picked up for the second consecutive month (+1.1% after +0.5%), after a weak start this year (–0.9% over Q1).
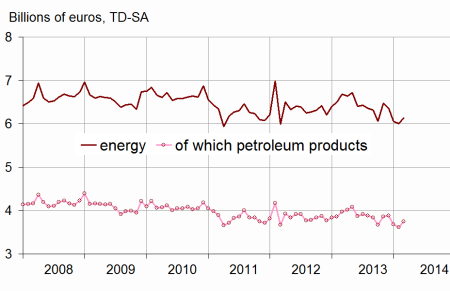
Energy: marked downturn
In April, household consumption of energy products fell distinctly (–3.3%) after a rebound in March (+2.8%). This development was mainly due to a decrease in expenditure for heating purposes (electricity, gas, heating oil…), which went down because of above average temperatures in April once again. Moreover, fuel expenditure dipped as well.
The evolution of household consumption of goods in March is scaled up by 0.2 points
Household consumption expenditure on goods is now estimated at +0.6%, instead of 0.4% estimated for the previous publication.
This revision resulted mainly from the benchmarking on reviewed annual accounts along the change to the ‘2010 year-base’, from the reestimation of calendar and seasonal adjustment models, as well as from the integration of new information on the indicators commonly used.
tableautab1_eng – Household consumption expenditure on goods
| Feb. | March | April | April2014/ | |
|---|---|---|---|---|
| 2014 | 2014 | 2014 | April2013 | |
| Food products | 15.672 | 15.745 | 15.919 | |
| Change (%) | –0.5 | 0.5 | 1.1 | 2.7 |
| Engineered goods | 19.800 | 19.776 | 19.739 | |
| Change (%) | 0.0 | –0.1 | –0.2 | 1.8 |
| Durables | 9.757 | 9.787 | 9.835 | |
| Change (%) | 1.2 | 0.3 | 0.5 | 3.6 |
| Of which Automobiles | 4.698 | 4.718 | 4.750 | |
| Change (%) | 3.0 | 0.4 | 0.7 | 4.0 |
| Of which Household durables | 3.796 | 3.822 | 3.828 | |
| Change (%) | –1.1 | 0.7 | 0.2 | 3.9 |
| Textile-leather | 4.052 | 3.985 | 3.924 | |
| Change (%) | –2.6 | –1.7 | –1.5 | –0.6 |
| Other engineered goods | 5.990 | 6.007 | 5.986 | |
| Change (%) | –0.2 | 0.3 | –0.4 | 0.5 |
| Energy | 6.759 | 6.945 | 6.715 | |
| Change (%) | –1.3 | 2.8 | –3.3 | –11.4 |
| Including petroleum products | 4.143 | 4.337 | 4.187 | |
| Change (%) | –2.2 | 4.7 | –3.4 | –10.2 |
| Total | 42.192 | 42.450 | 42.335 | |
| Change (%) | –0.4 | 0.6 | –0.3 | –0.5 |
| Manufactured goods | 36.181 | 36.446 | 36.450 | |
| Change (%) | –0.5 | 0.7 | 0.0 | 1.2 |
graphiquegraph4_new_ang – Energy
Documentation
Methodology (pdf,23 Ko)
Pour en savoir plus
