


 31 October 2013
2013- n° 255Overall producer prices of agricultural products decreased in September Indices of agricultural prices - September 2013
31 October 2013
2013- n° 255Overall producer prices of agricultural products decreased in September Indices of agricultural prices - September 2013
In september 2013, overall production prices of agricultural products decreased by 1.7 % compared to August ; over one year they went down by 5.0 %.
In september 2013, overall production prices of agricultural products decreased by 1.7 % compared to August ; over one year they went down by 5.0 %.
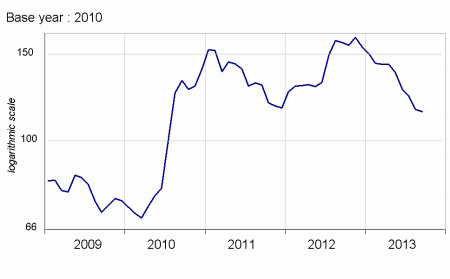
Cereal prices continued to drop in September (–1.0 %). The very significant crop in united-States weighed on the prices. The global availability of wheat, which was heightened by significant crops in the Northern hemisphere, allowed to satisfy the sustained demand ; still, wheat price slightly went up.
graphiquecereal – Production prices of cereals
Oleaginous prices rose this month (+1.6 %). Sunflower became more expensive : the supply was getting lower as the harvests were to occur lately in Europe.
Potatoes prices stayed at a high level as the trading campaign was beginning, increasing by 5.2% over one year. The crop in North-Western Europe would only slightly rise as a result of the tumble in yields in Germany.
Wine prices slightly went up in September compared to August (+0.9 %), but stayed at a high level year-over-year (+14.4%). The prices for some PDO wines were sustained by the export demand. The less significant crop last autumn explained the rise of other wines prices over a year.
Fresh fruits prices rose year-over-year (+5.0 %). Apple prices increased, as early varieties sold well through exportations. Plum and grape prices were high, due to past bad weather which had affected the production. Consumers turned aside a little from pears, which ended up in competition with summer fruits still present this month.
graphiquevegetable – Production prices of fresh vegetables
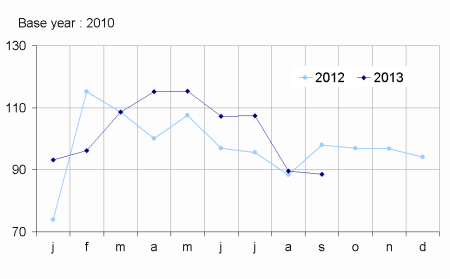
Fresh vegetables prices decreased year-over-year (–9.6 %). The melons, delayed by a dull spring, abounded while the demand slumped. The seasonal decrease in the demand was marked as well this year for tomatoes. On the other hand, the lettuces and the cucumbers were easily traded because they were less numerous than last year.
graphiquepig – Production prices of big cattle and pigs
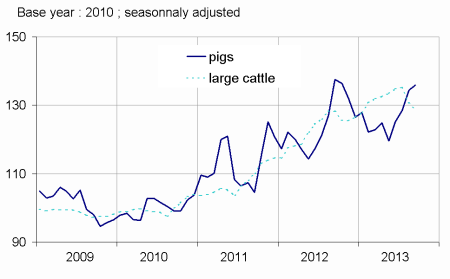
On a seasonally adjusted basis, animals prices dipped in September (-0.4 %). Prices of big cattle stagnated over one year due to a limited supply, which balanced a sluggish demand. Conversely, sheep prices inceased over the same period : the cut in the French livestock and the demand from North Africa backed the prices up.
Eggs prices picked up this month (+17.3%), due to an augmented exportation demand.
tableauTab1 – Indices of producer prices of agricultural products (IPPAP)
| Variation as % over | |||||
|---|---|---|---|---|---|
| weights | Sept 2013 | a month | 3 month | a year | |
| raw | Seasonally adjusted data | raw | |||
| Agricultural goods output | 1000 | 118.7 | –1.7 | –4.3 | –5.0 |
| excluding fruits and vegetables | 900 | 120.6 | –1.4 | –3.6 | –5.2 |
| Crop output (excluding fruits and vegetables) | 502 | 117.5 | –2.7 | –6.8 | –11.7 |
| Cereals | 190 | 114.8 | –1.0 | –9.8 | –27.5 |
| of which soft wheat | 113 | 112.5 | +1.0 | –8.1 | –28.8 |
| grain maize | 42 | 110.3 | –6.2 | –17.5 | –27.9 |
| Potatoes | 26 | 181.0 | /// | /// | +5.2 |
| Wines | 171 | 119.6 | +0.9 | +1.5 | +14.4 |
| Protected designation of origine | 135 | 119.0 | +0.8 | +2.4 | +13.2 |
| other wines | 36 | 121.9 | +1.1 | –1.5 | +19.0 |
| Oleaginous | 49 | 98.1 | +1.6 | –19.0 | –29.3 |
| Horticultural products | 31 | 105.5 | –1.5 | –0.1 | +1.1 |
| Other crop products | 34 | 112.2 | –3.9 | –4.4 | –7.5 |
| Fruits and vegetables (1) | 100 | 99.9 | /// | /// | –3.2 |
| Fresh vegetables | 51 | 88.5 | /// | /// | –9.6 |
| Fresh fruits | 41 | 115.2 | /// | /// | +5.0 |
| Animal output | 398 | 124.7 | +0.2 | +0.7 | +3.9 |
| Animals | 234 | 127.1 | –0.4 | –0.3 | +0.3 |
| of which large cattle | 96 | 128.2 | –1.3 | –4.5 | +0.3 |
| calves | 26 | 106.4 | +1.4 | –1.0 | 0.0 |
| pigs | 54 | 143.1 | +1.1 | +8.5 | –1.2 |
| sheep | 10 | 121.1 | –1.7 | +3.5 | +10.0 |
| poultry | 44 | 119.4 | –1.3 | –2.2 | –0.1 |
| of which chicken | 18 | 120.9 | –1.3 | –2.2 | –0.5 |
| Milk | 149 | 122.3 | 0.0 | +1.2 | +15.3 |
| of which cow milk (2) | 139 | 123.5 | 0.0 | +1.2 | +16.1 |
| Eggs | 15 | 109.9 | +17.3 | +14.7 | –28.7 |
- (1) Including vegetables for industry.
- (2)The price for September is not yet known and therefore is estimated by carrying forward the seasonally adjusted price from August
- Sources: INSEE - SSP (Ministry of Agriculture)
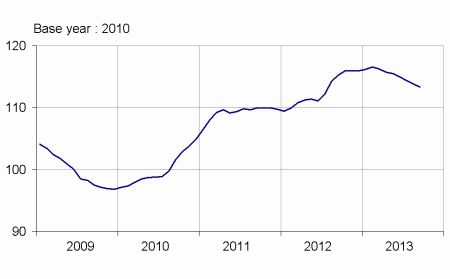
Purchase prices of the means of agricultural production decreased in September.
The prices of intermediate consumptions continued to dip in September (-0.8 %). Fertilisers and food for animals prices kept dropping, showing decreases by 9.3 % and 5.1 %. Investment prices rose (+0.7 %), as material for harvesting became more expensive.
graphiquemeans – Purchase prices of the means of agricultural products
tableauTab2 – Indices of purchase prices of the means of agricultural production (IPAMPA)
| weights | Sept. 2013 | Variation as % over | |||
|---|---|---|---|---|---|
| a month | 3 month | a year | |||
| Total input | 1000 | 113.5 | –0.4 | –1.3 | –1.6 |
| Intermediate consumptions | 755 | 115.8 | –0.8 | –1.9 | –2.6 |
| Energy (1) | 102 | 121.0 | +0.2 | +2.6 | –3.4 |
| Seeds | 67 | 108.4 | +0.2 | +0.2 | +3.8 |
| Fertilisers and soil improvers | 100 | 117.4 | –1.5 | –4.9 | –9.3 |
| Plant protection products | 83 | 101.3 | +0.2 | +0.5 | +0.3 |
| Animal feed | 211 | 128.4 | –2.0 | –5.1 | –5.1 |
| Veterinary expenses | 50 | 109.5 | +0.2 | +0.7 | +3.3 |
| Small equipment and tools | 16 | 108.9 | –0.5 | –0.2 | +2.3 |
| Maintenance of materials | 65 | 108.9 | 0.0 | +0.2 | +2.4 |
| Maintenance of buildings | 9 | 106.7 | +0.1 | –0.3 | +0.9 |
| Other goods and services | 52 | 102.2 | –0.1 | +0.1 | +0.5 |
| Goods and services contributing to investment | 245 | 106.5 | +0.7 | +0.5 | +2.3 |
| Material | 193 | 106.6 | +0.9 | +1.1 | +3.0 |
| Tractors | 82 | 105.8 | +0.3 | +0.2 | +1.9 |
| Machinery and plant for cultivation | 37 | 106.7 | +0.4 | +1.4 | +4.5 |
| Machinery and plant for harvesting | 43 | 109.7 | +3.2 | +3.2 | +5.6 |
| Utility vehicles | 19 | 103.1 | +0.1 | +0.3 | +0.7 |
| Total input | 52 | 106.4 | –0.3 | –1.5 | –0.4 |
- (1) The repayment of the domestic tax on energy products (TICPE) benefiting farmers has been applied in advance for the year 2013
- Sources: INSEE - SSP (Ministry of Agriculture
Documentation
Methodology (pdf,122 Ko)
Pour en savoir plus
Time series : Indices of agricultural prices
