


 31 October 2012
2012- n° 271Households’ consumption on goods slightly increased in September (+0.1%) and over
the third quarter (+0.2%) Household consumption expenditure on goods - September 2012
31 October 2012
2012- n° 271Households’ consumption on goods slightly increased in September (+0.1%) and over
the third quarter (+0.2%) Household consumption expenditure on goods - September 2012
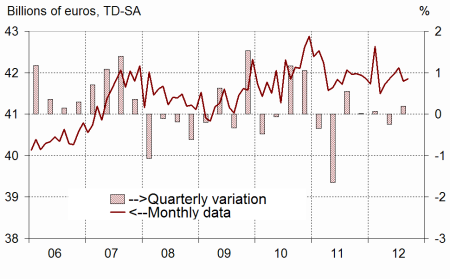
In September, households’ expenditure on goods increased by 0.1% in volume*, after having declined by 0.8% in August. They increased by 0.2% over the third quarter (after a decline of similar magnitude during the second quarter). The slight increase of expenditure in September was attributable to the increase of expenditure on household durables.
In September, households’ expenditure on goods increased by 0.1% in volume*, after having declined by 0.8% in August. They increased by 0.2% over the third quarter (after a decline of similar magnitude during the second quarter). The slight increase of expenditure in September was attributable to the increase of expenditure on household durables.
[* Volumes are chained and all figures are trading days and seasonally adjusted.]
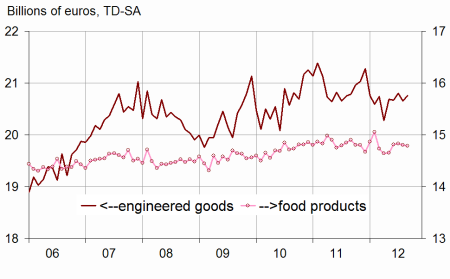
Engineered goods : near stability in September
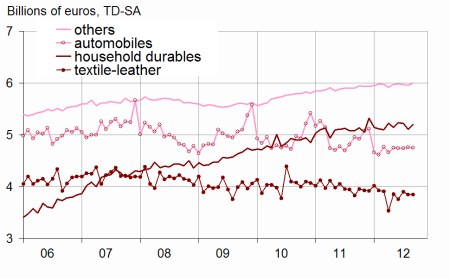
Durables: increasing
Households’ expenditure on durables increased in September (+0.6% after -0.8% in August), notably driven up by household durables. Over the quarter, they slightly increased (+0.1%, after +1.0% in Q2). Despite a slight decrease in September (–0.2% after +0.5% in August), car purchases rose over the course of the third quarter (+0.8% after +0.7% in Q2).
Textile-leather: stable in September
Consumption of textile and leather remained stable in September (after –1.3% in August). It bounced by 3.9% in the third quarter after a 5.9% decrease over the second quarter.
Other engineered goods: increasing
Consumption expenditure on other engineered goods increased in September (+0.8%, after -0.3% in August), and slightly increased over the third quarter (+0.3%, after -0.2% in Q2). The overall growth is mainly driven by hardware purchases.
graphiquegraph1_new_ang – Total consumption of goods
graphiquegraph2_new_ang – Food and engineered goods
graphiquegraph3_new_ang – Decomposition of engineered goods
Food products: slighlty decreasing
In September, consumption of food products slighlty decreased (-0.1%, after -0.2% in August). It however increased by 0.7% during the third quarter (after -1.2% in Q2) thanks to the July growth carry-over.
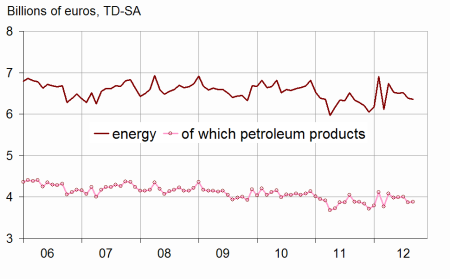
Energy: decreasing
Households’ consumption of energy products kept decreasing in September (-0.4% after -2.1% in August). It decreased over the third quarter (-2.6% after +2.9% in Q2).
The evolution of household consumption in goods in August is not revised.
The decrease of household consumption in goods in January is still estimated at –0.8% as it was for the previous publication. Some slight revisions offset each other.
tableauenglish_trim – Households consumption expenditures on goods
| July | August | Sept. | Sept.12/ | Q3 12/ | |
|---|---|---|---|---|---|
| 2012 | 2012 | 2012 | Sept.11 | Q2 12 | |
| Food products | 14.829 | 14.805 | 14.790 | ||
| Change (%) | 0.1 | –0.2 | –0.1 | –0.8 | 0.7 |
| Engineered goods | 20.799 | 20.649 | 20.756 | ||
| change (%) | 0.6 | –0.7 | 0.5 | –0.1 | 0.9 |
| Of which: | |||||
| Automobiles | 4.738 | 4.763 | 4.754 | ||
| Change (%) | 0.0 | 0.5 | –0.2 | –4.1 | 0.8 |
| Household durables | 5.225 | 5.106 | 5.192 | ||
| Change (%) | –0.1 | –2.3 | 1.7 | 2.2 | –0.5 |
| Textile-leather | 3.898 | 3.847 | 3.847 | ||
| Change (%) | 3.7 | –1.3 | 0.0 | 0.5 | 3.9 |
| Other engineered goods | 5.972 | 5.956 | 6.000 | ||
| Change (%) | –0.2 | –0.3 | 0.8 | 1.7 | 0.3 |
| Energy | 6.519 | 6.383 | 6.355 | ||
| Change (%) | 0.3 | –2.1 | –0.4 | 0.4 | –2.6 |
| Including petroleum products | 4.004 | 3.871 | 3.880 | ||
| Change (%) | 0.3 | –3.3 | 0.3 | –0.1 | –2.5 |
| Total | 42.124 | 41.800 | 41.849 | ||
| Change (%) | 0.4 | –0.8 | 0.1 | –0.3 | 0.2 |
| Manufactured goods | 36.501 | 36.184 | 36.271 | ||
| Change (%) | 0.4 | –0.9 | 0.2 | –0.5 | 0.7 |
graphiquegraph4_new_ang – Energy
Documentation
Methodology (pdf,23 Ko)
Pour en savoir plus
